A Billion Degrees of Separation

BBC Future

At a glance

The hottest (and coldest) data visualization we’ve ever created

Taking the temperature

What’s hotter than the sun? When does iron melt like butter? What’s the coldest place in the universe? And which creature on Earth could survive there? 

The BBC wanted answers. So to explore the f-f-freezing, sizzzling world of temperature, we cooked up an interactive thermometer to take us through the milestones from absolute cold to extreme heat.
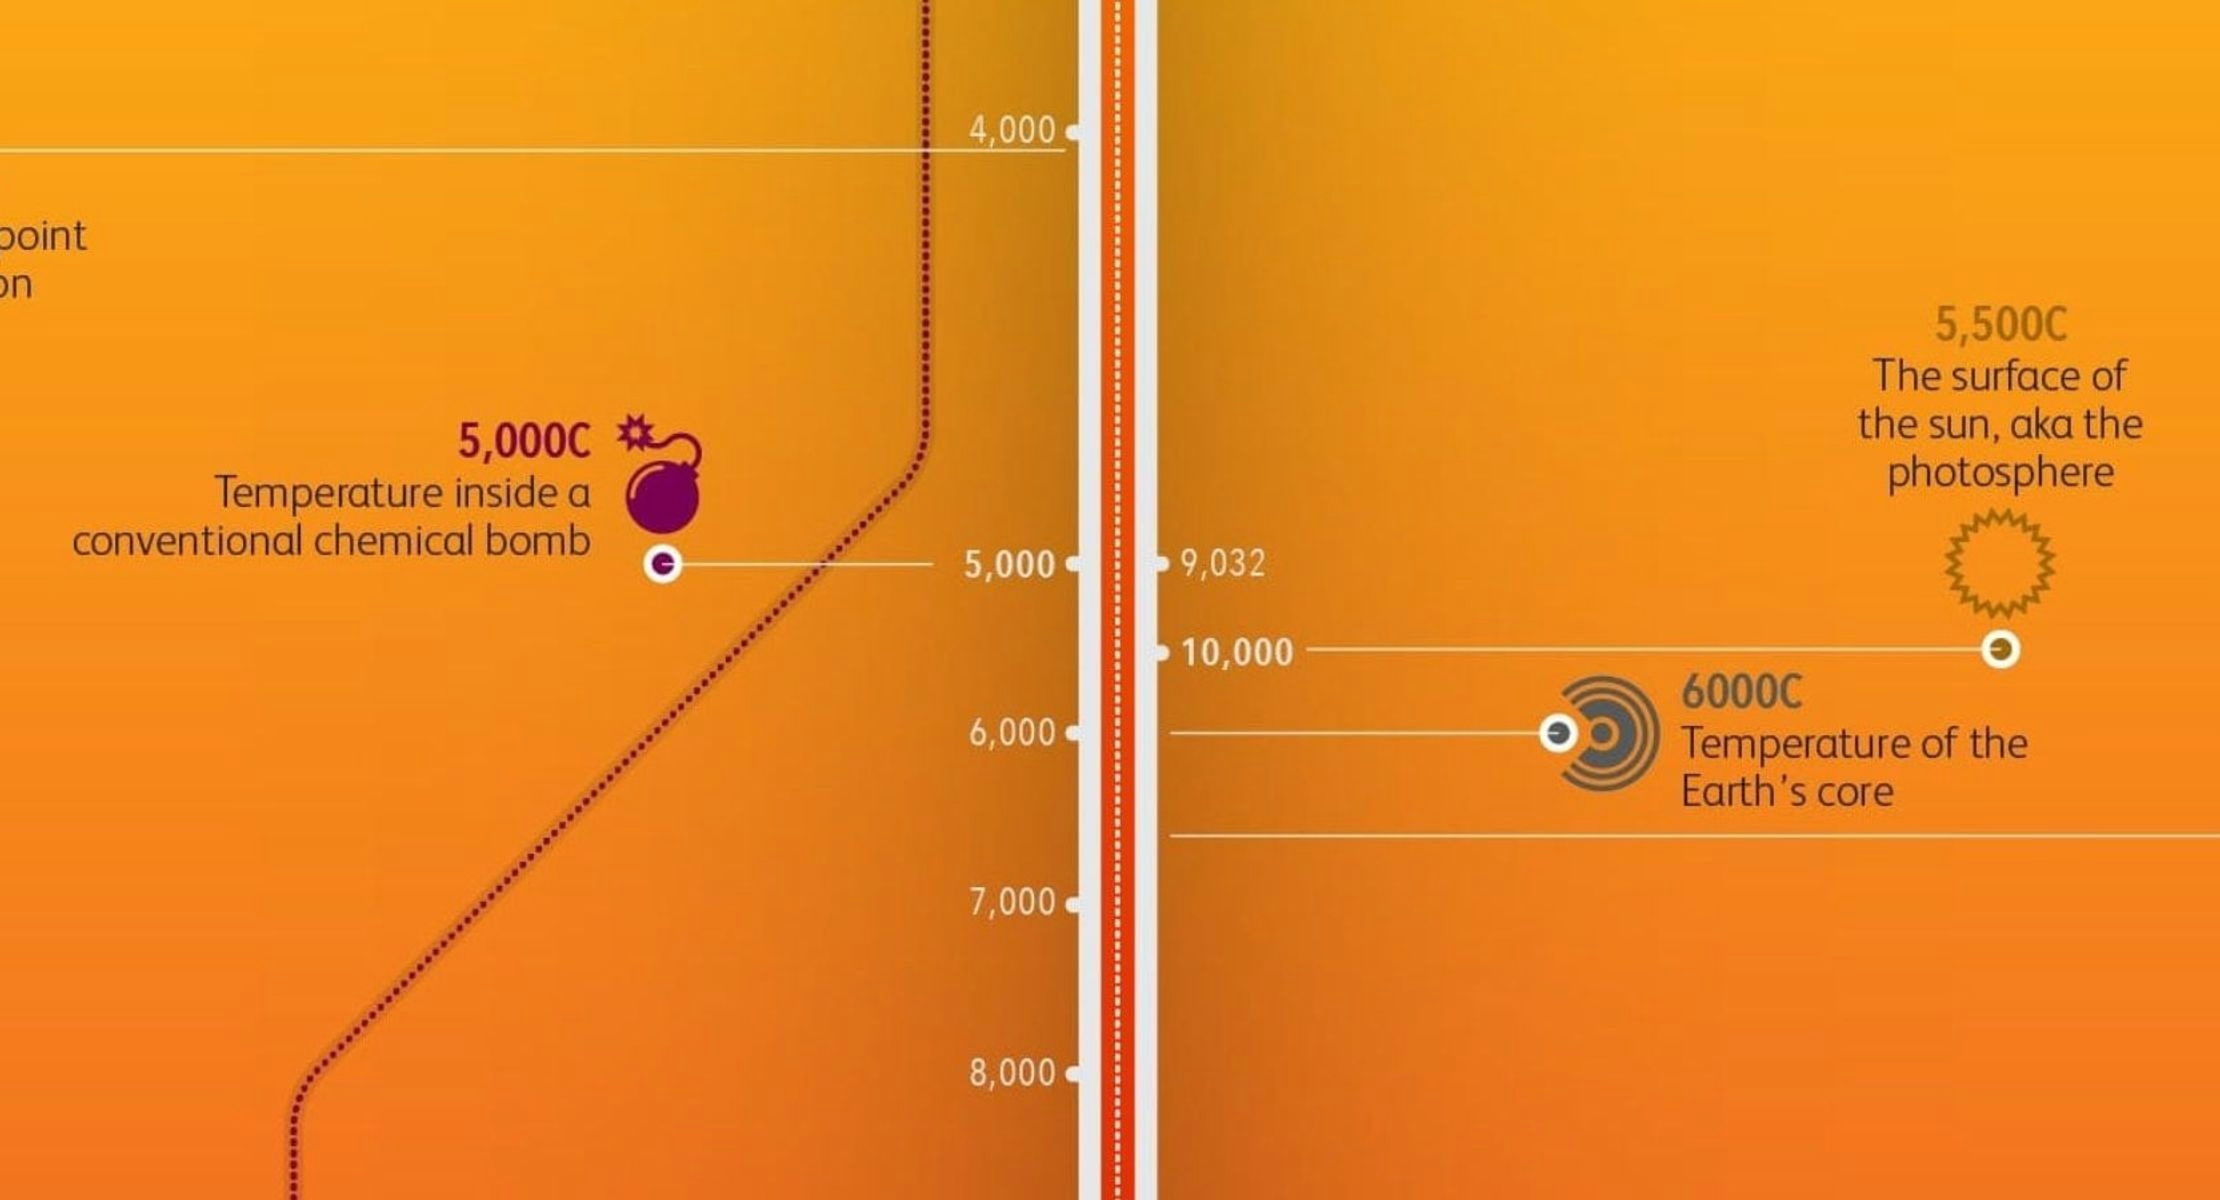
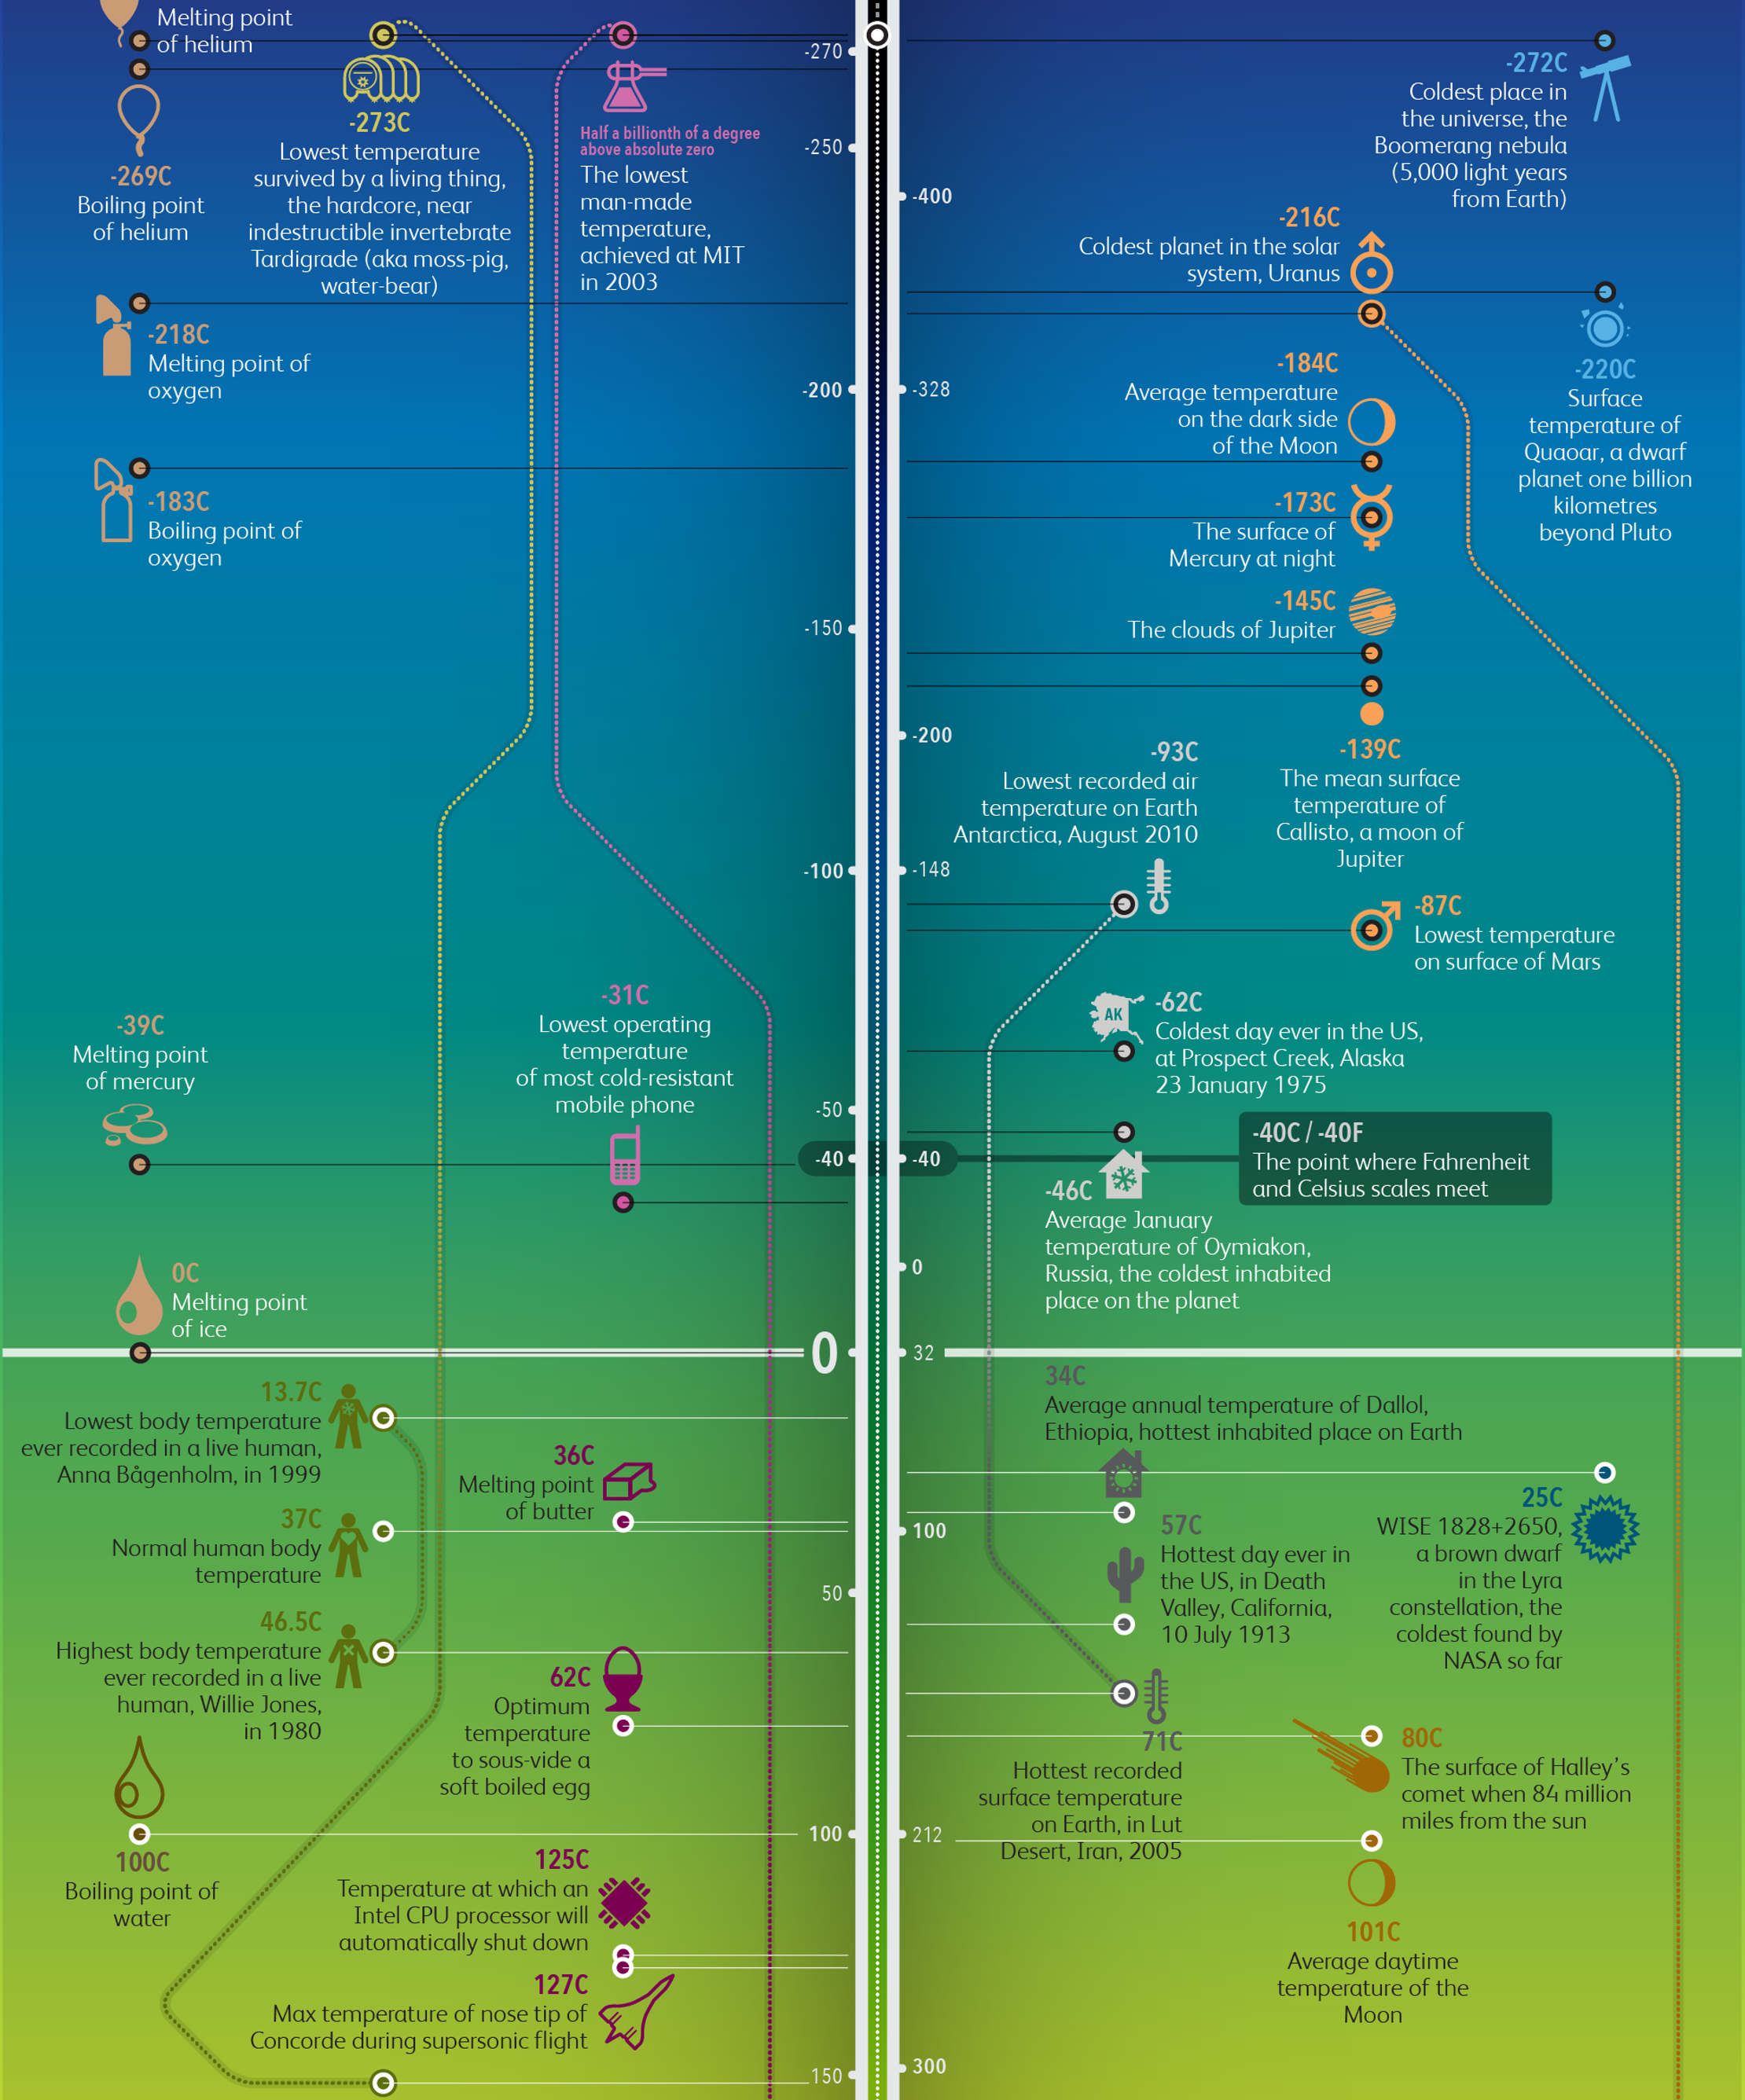
 

Heated discussions

To gather the most fascinating temperature-related data, we researched every hot topic and cool curiosity we could think of. 

We looked at the extremes in science and nature. Where things melt, from butter (36°C) to iron (1,538°C). Where things boil, from water (100°C) to carbon (4,027°C).

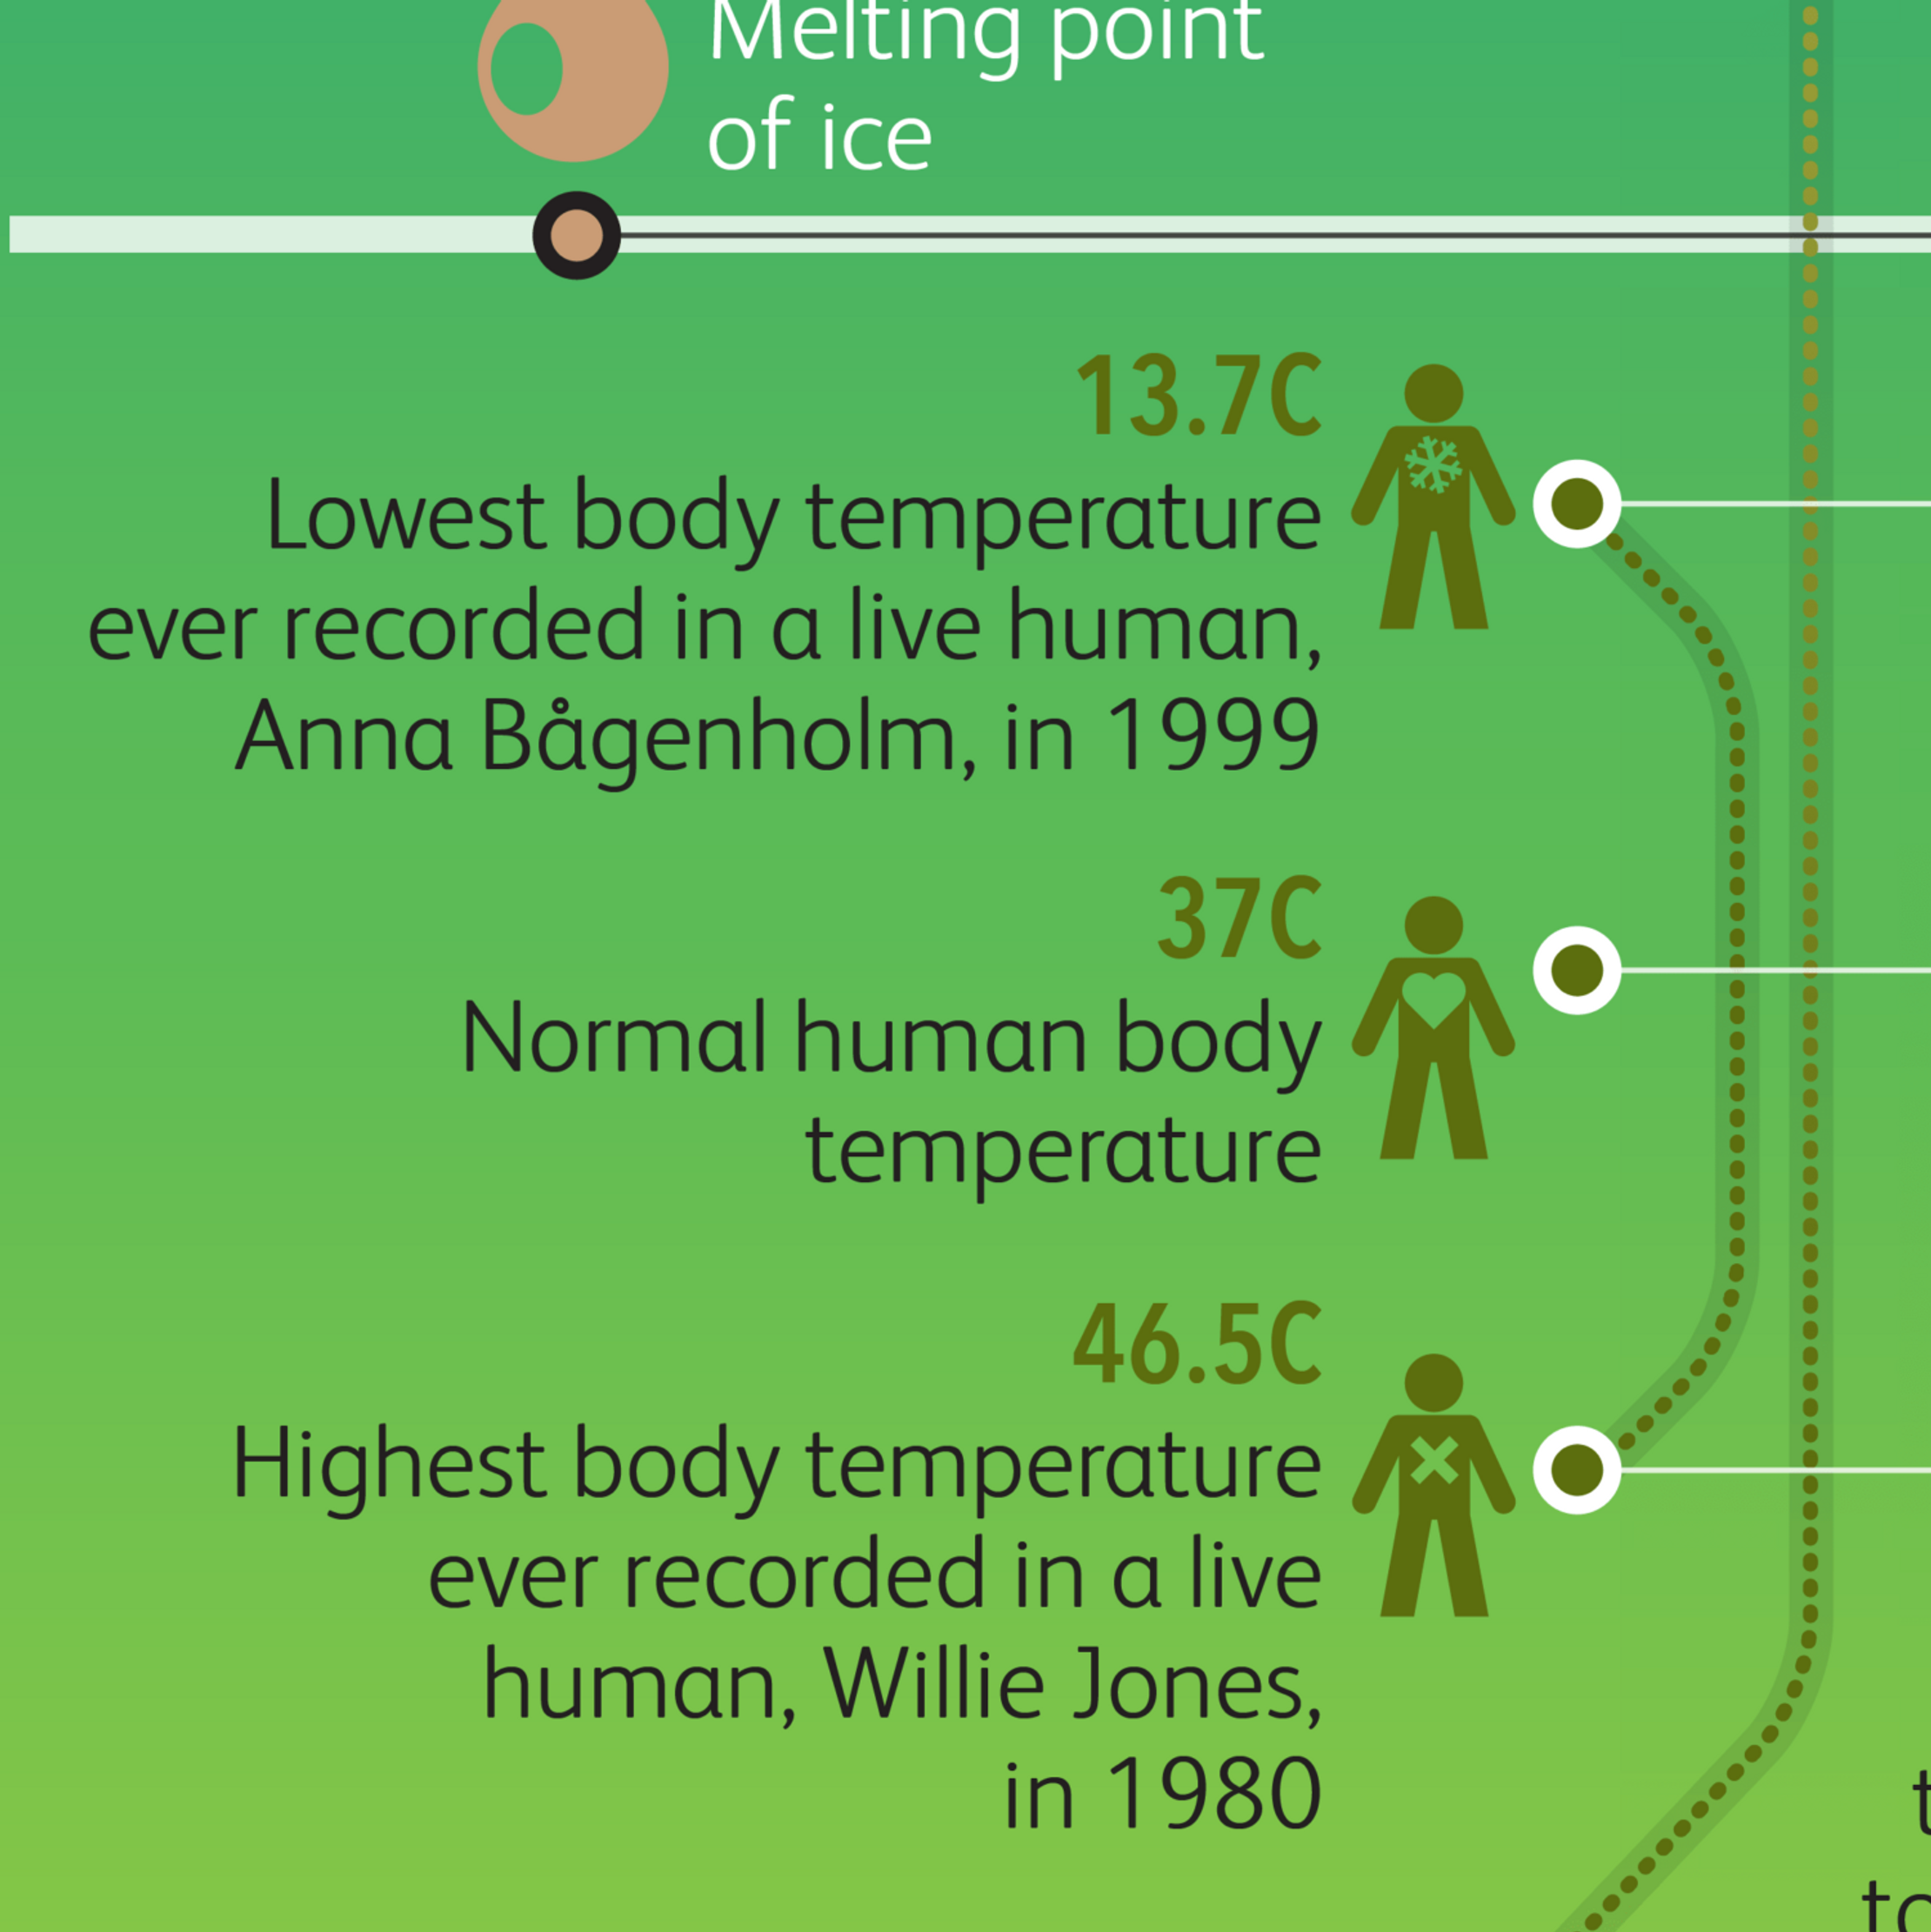
We discovered several people-powered world records, too. From the hottest guy in history (52-year-old heat stroke victim Willie Jones, who survived a body temp of 46.5°C) to the coldest inhabited place on Earth (the Siberian village of Oymyakon, -46°C).


Colourful categories

We organised this data into six categories, then divided them into two groups. 

Half were down to Earth (Elements, Living things, Man-made), the other half were far out (our planet, the solar system, the universe).
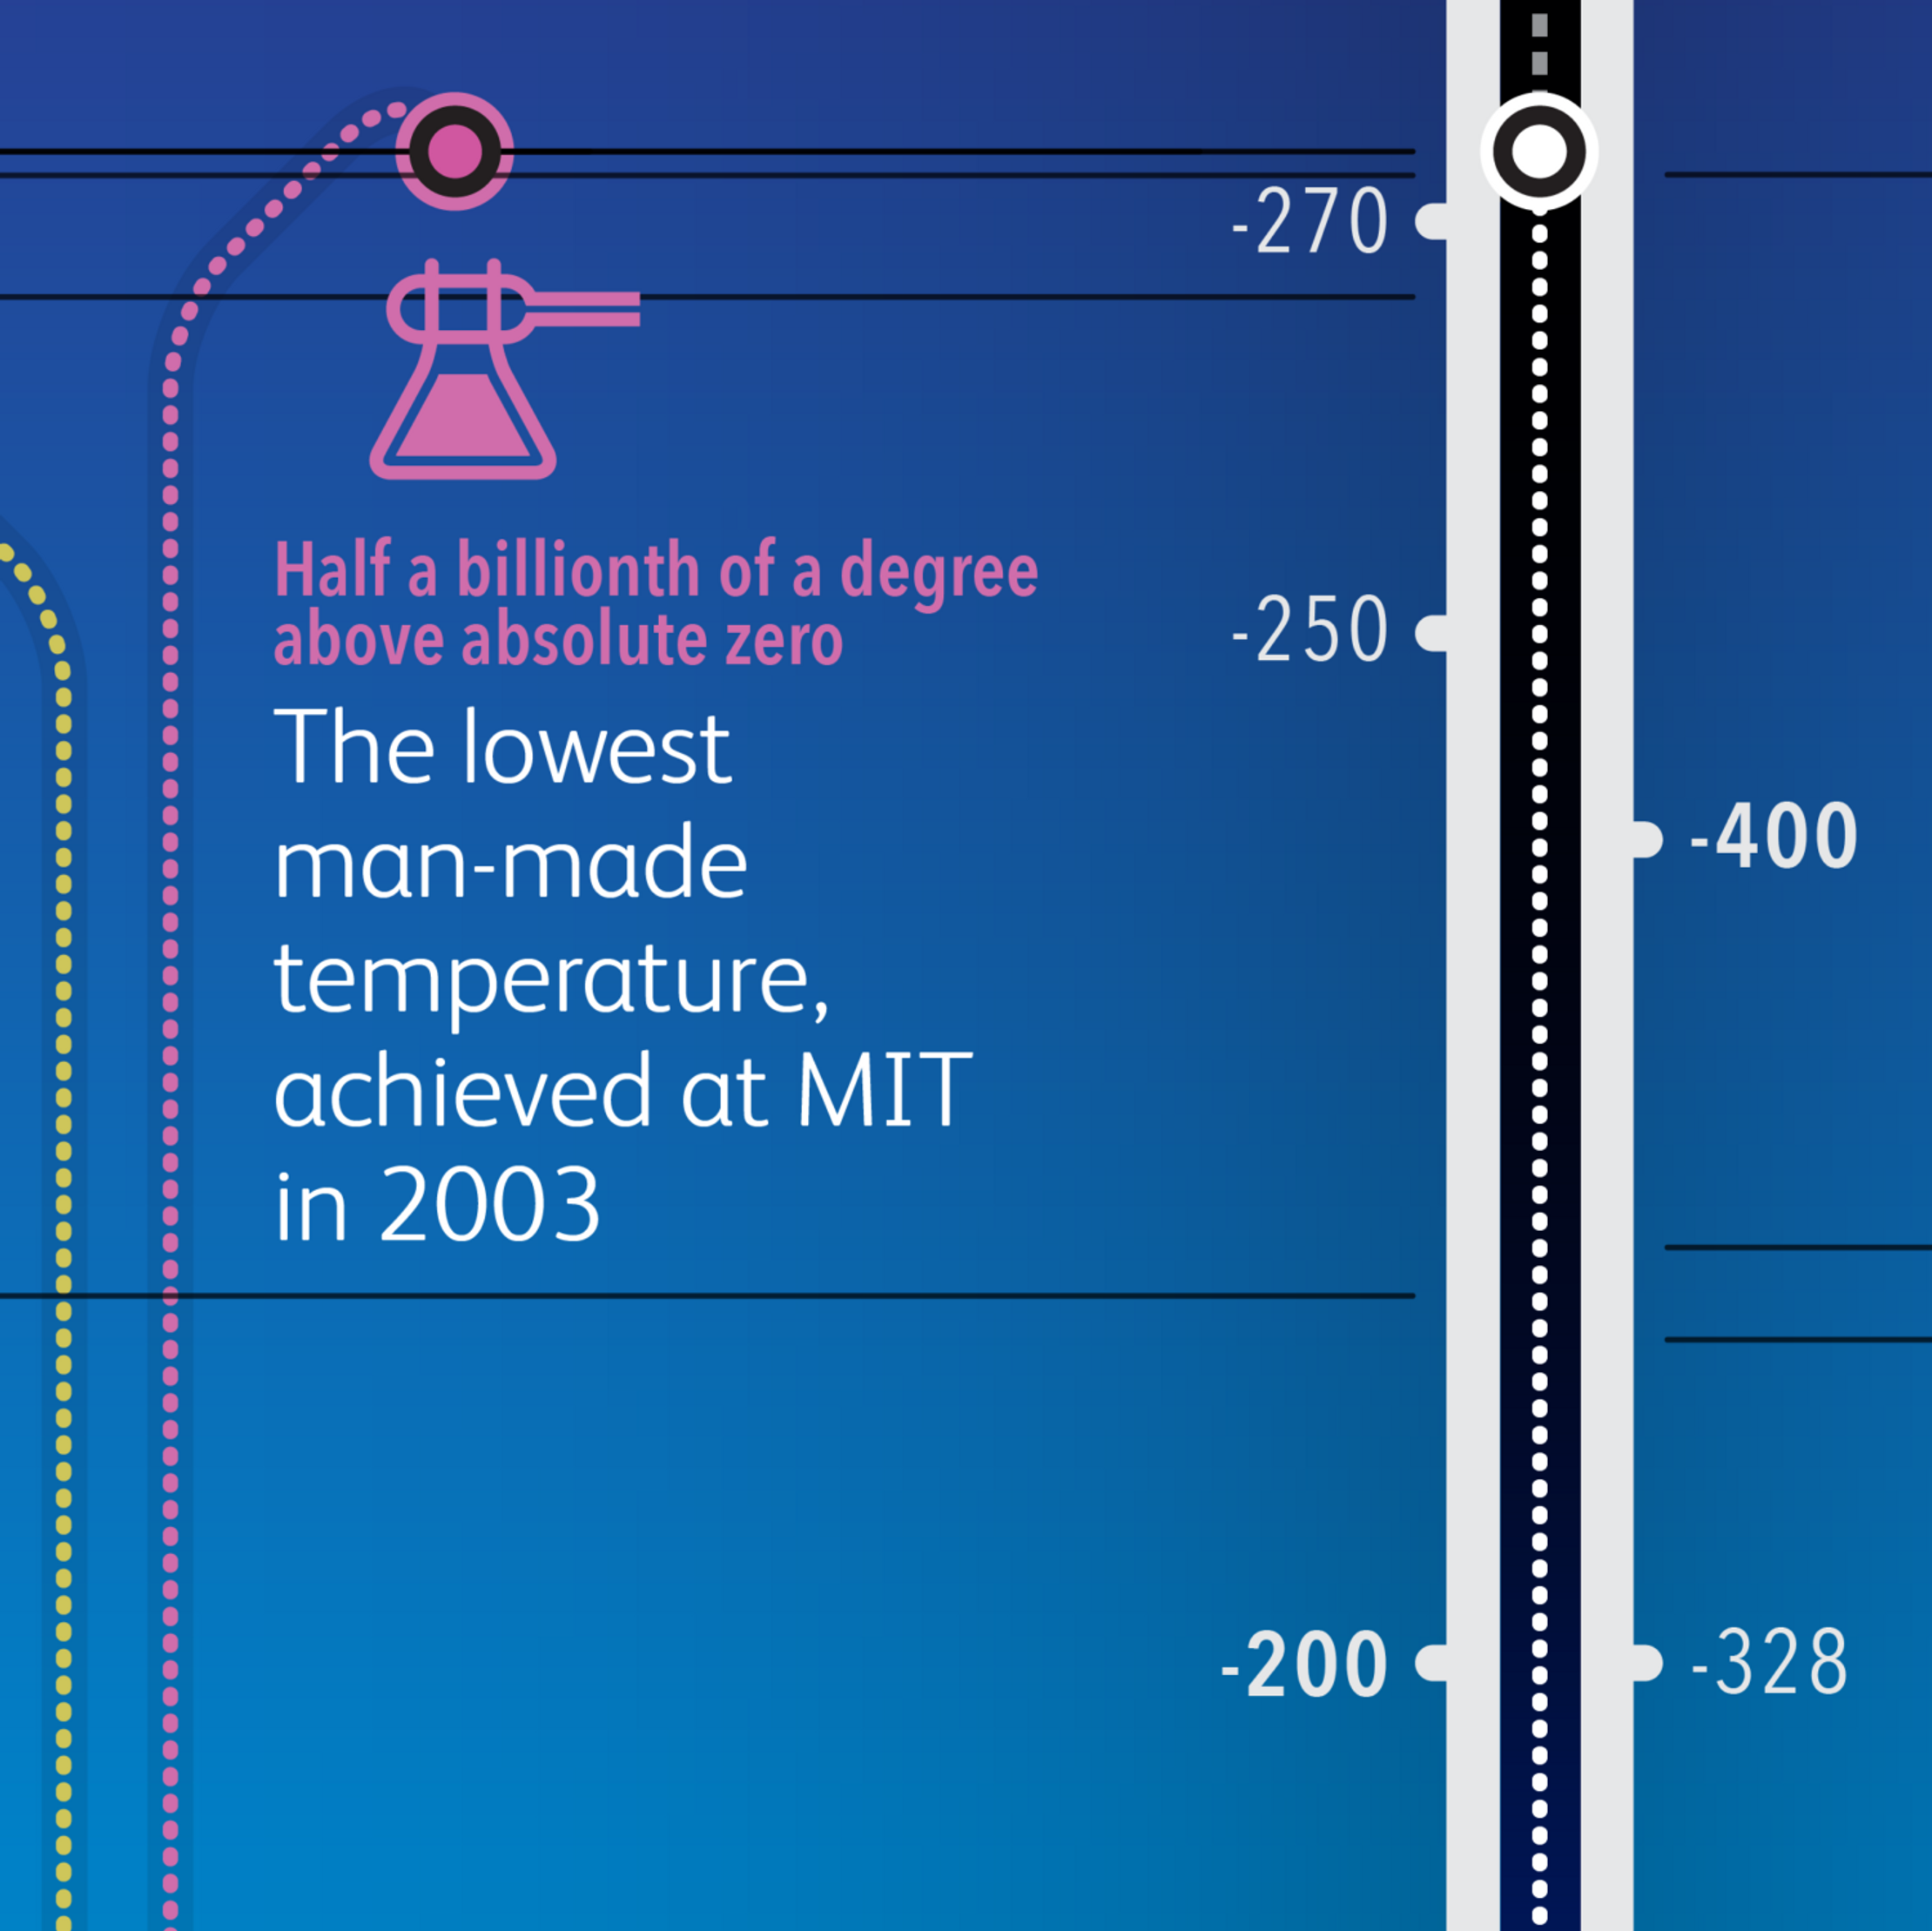
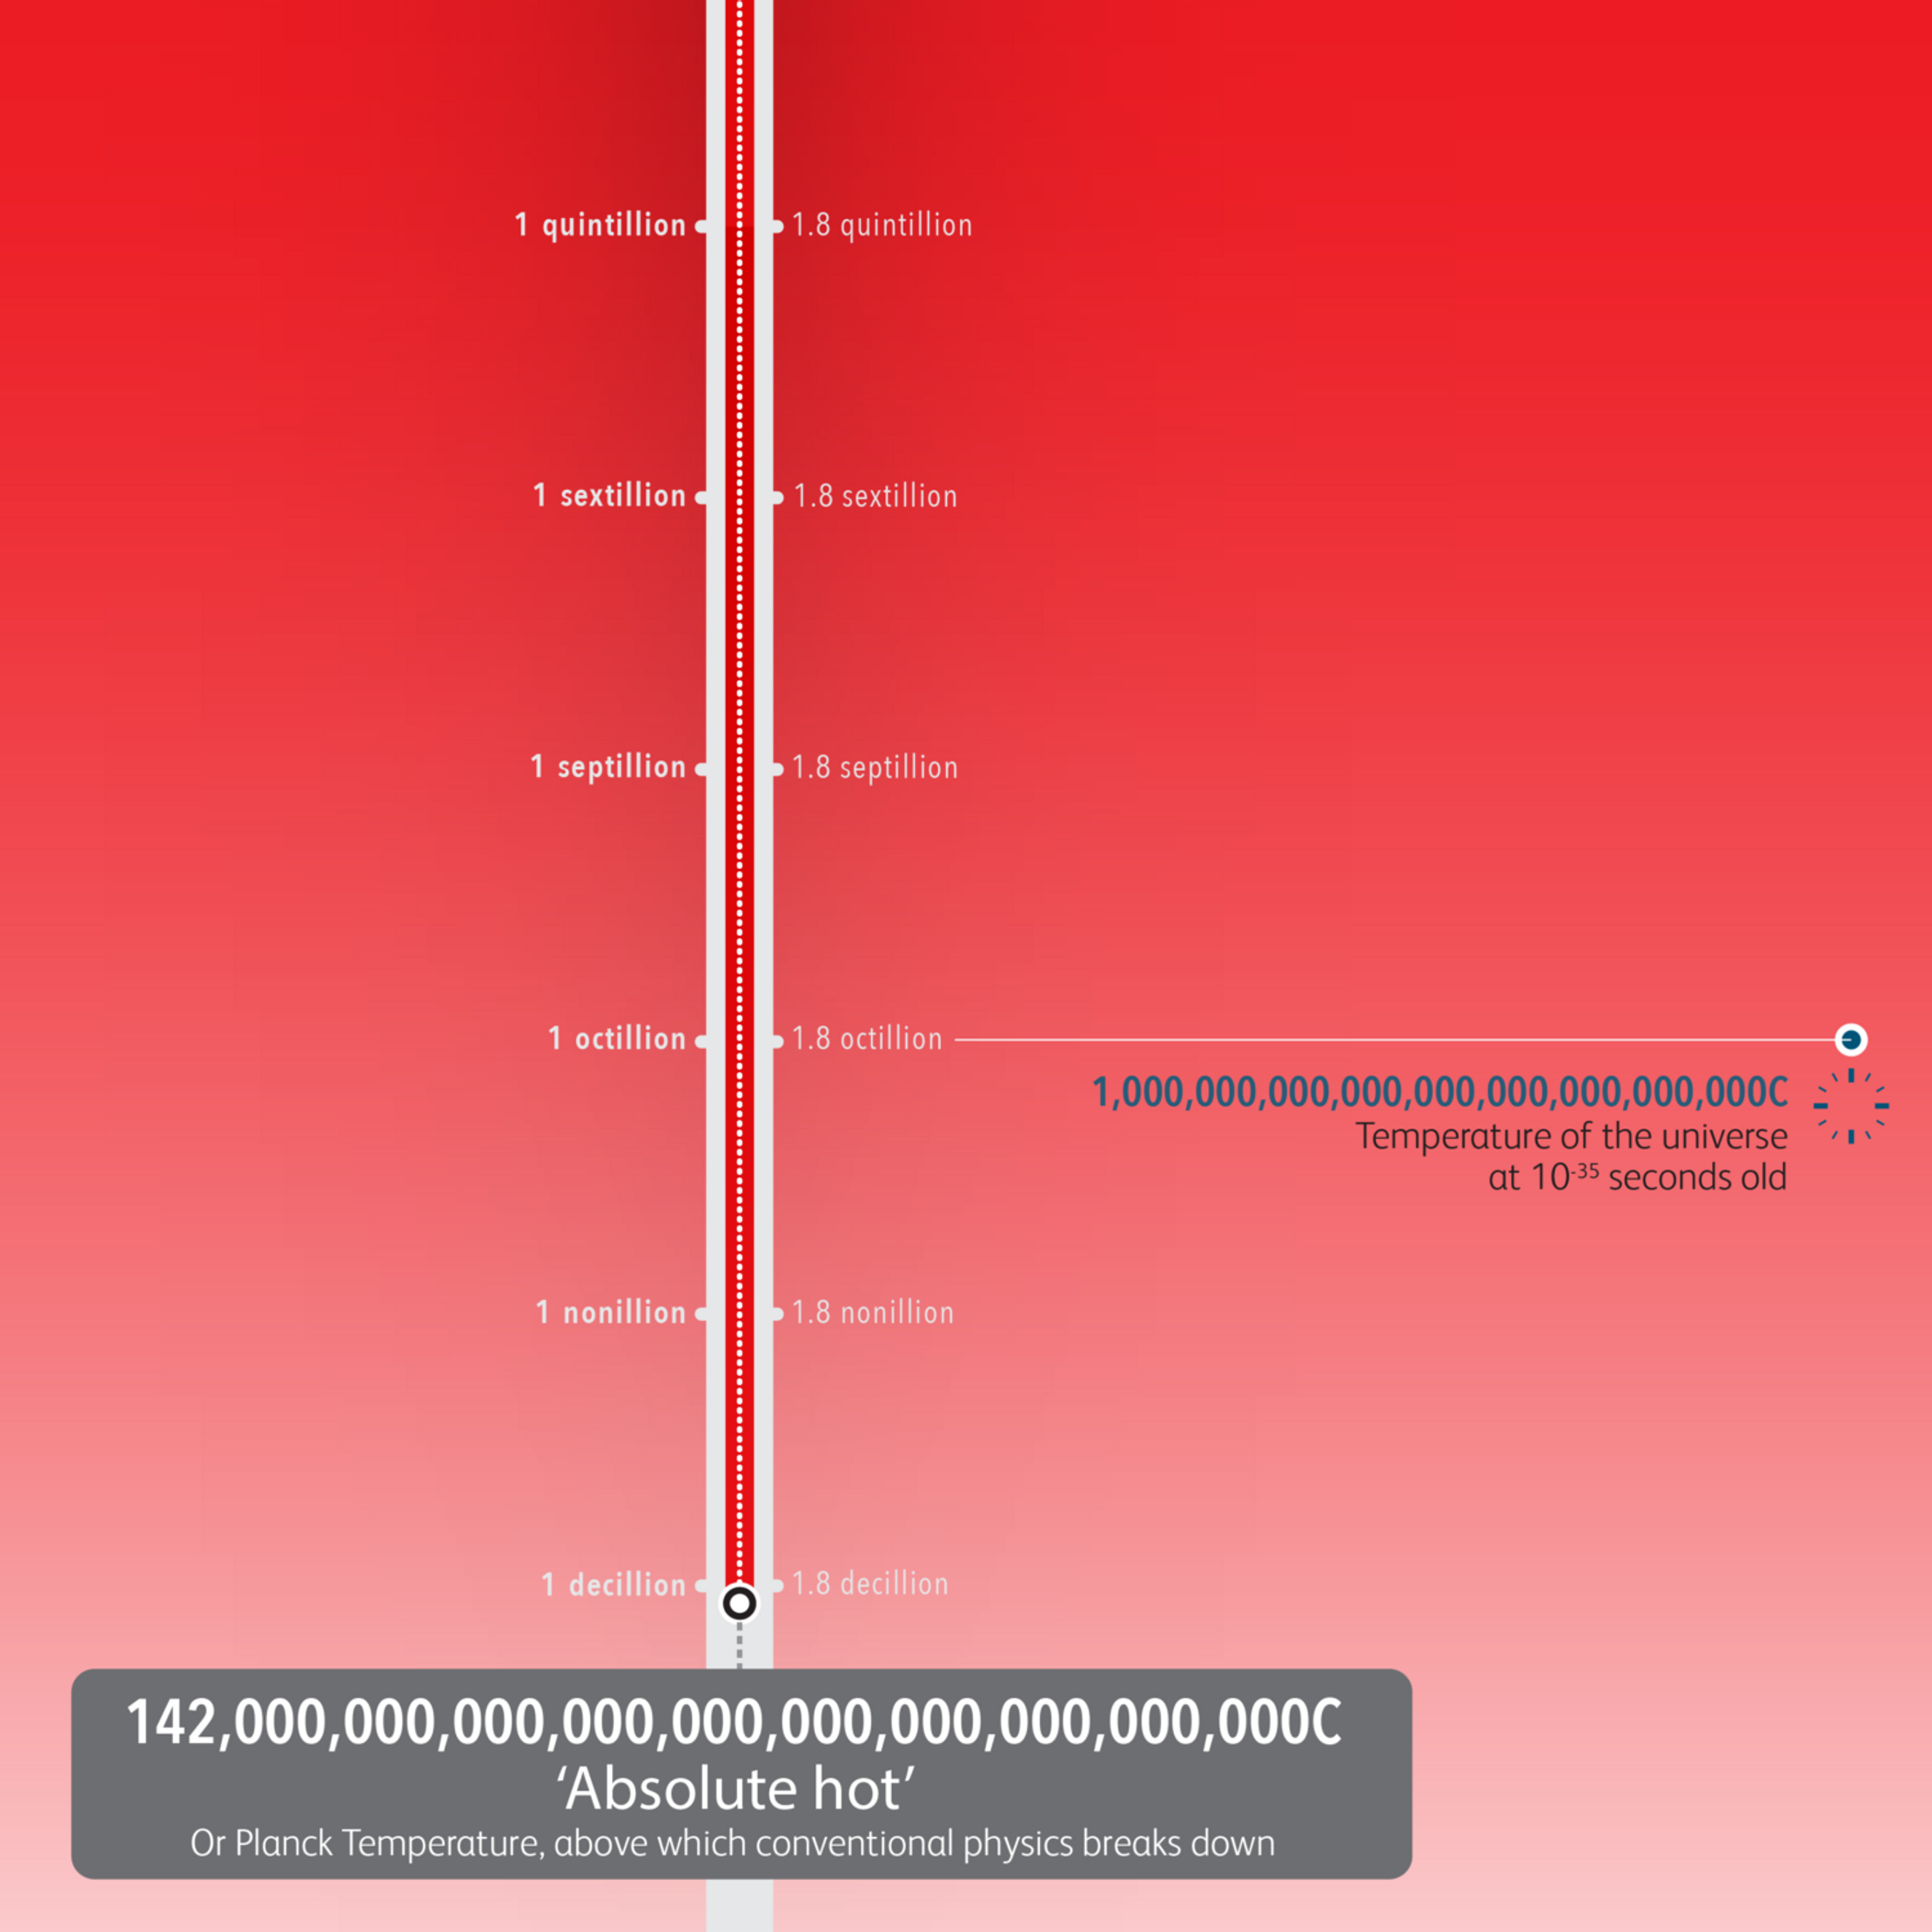
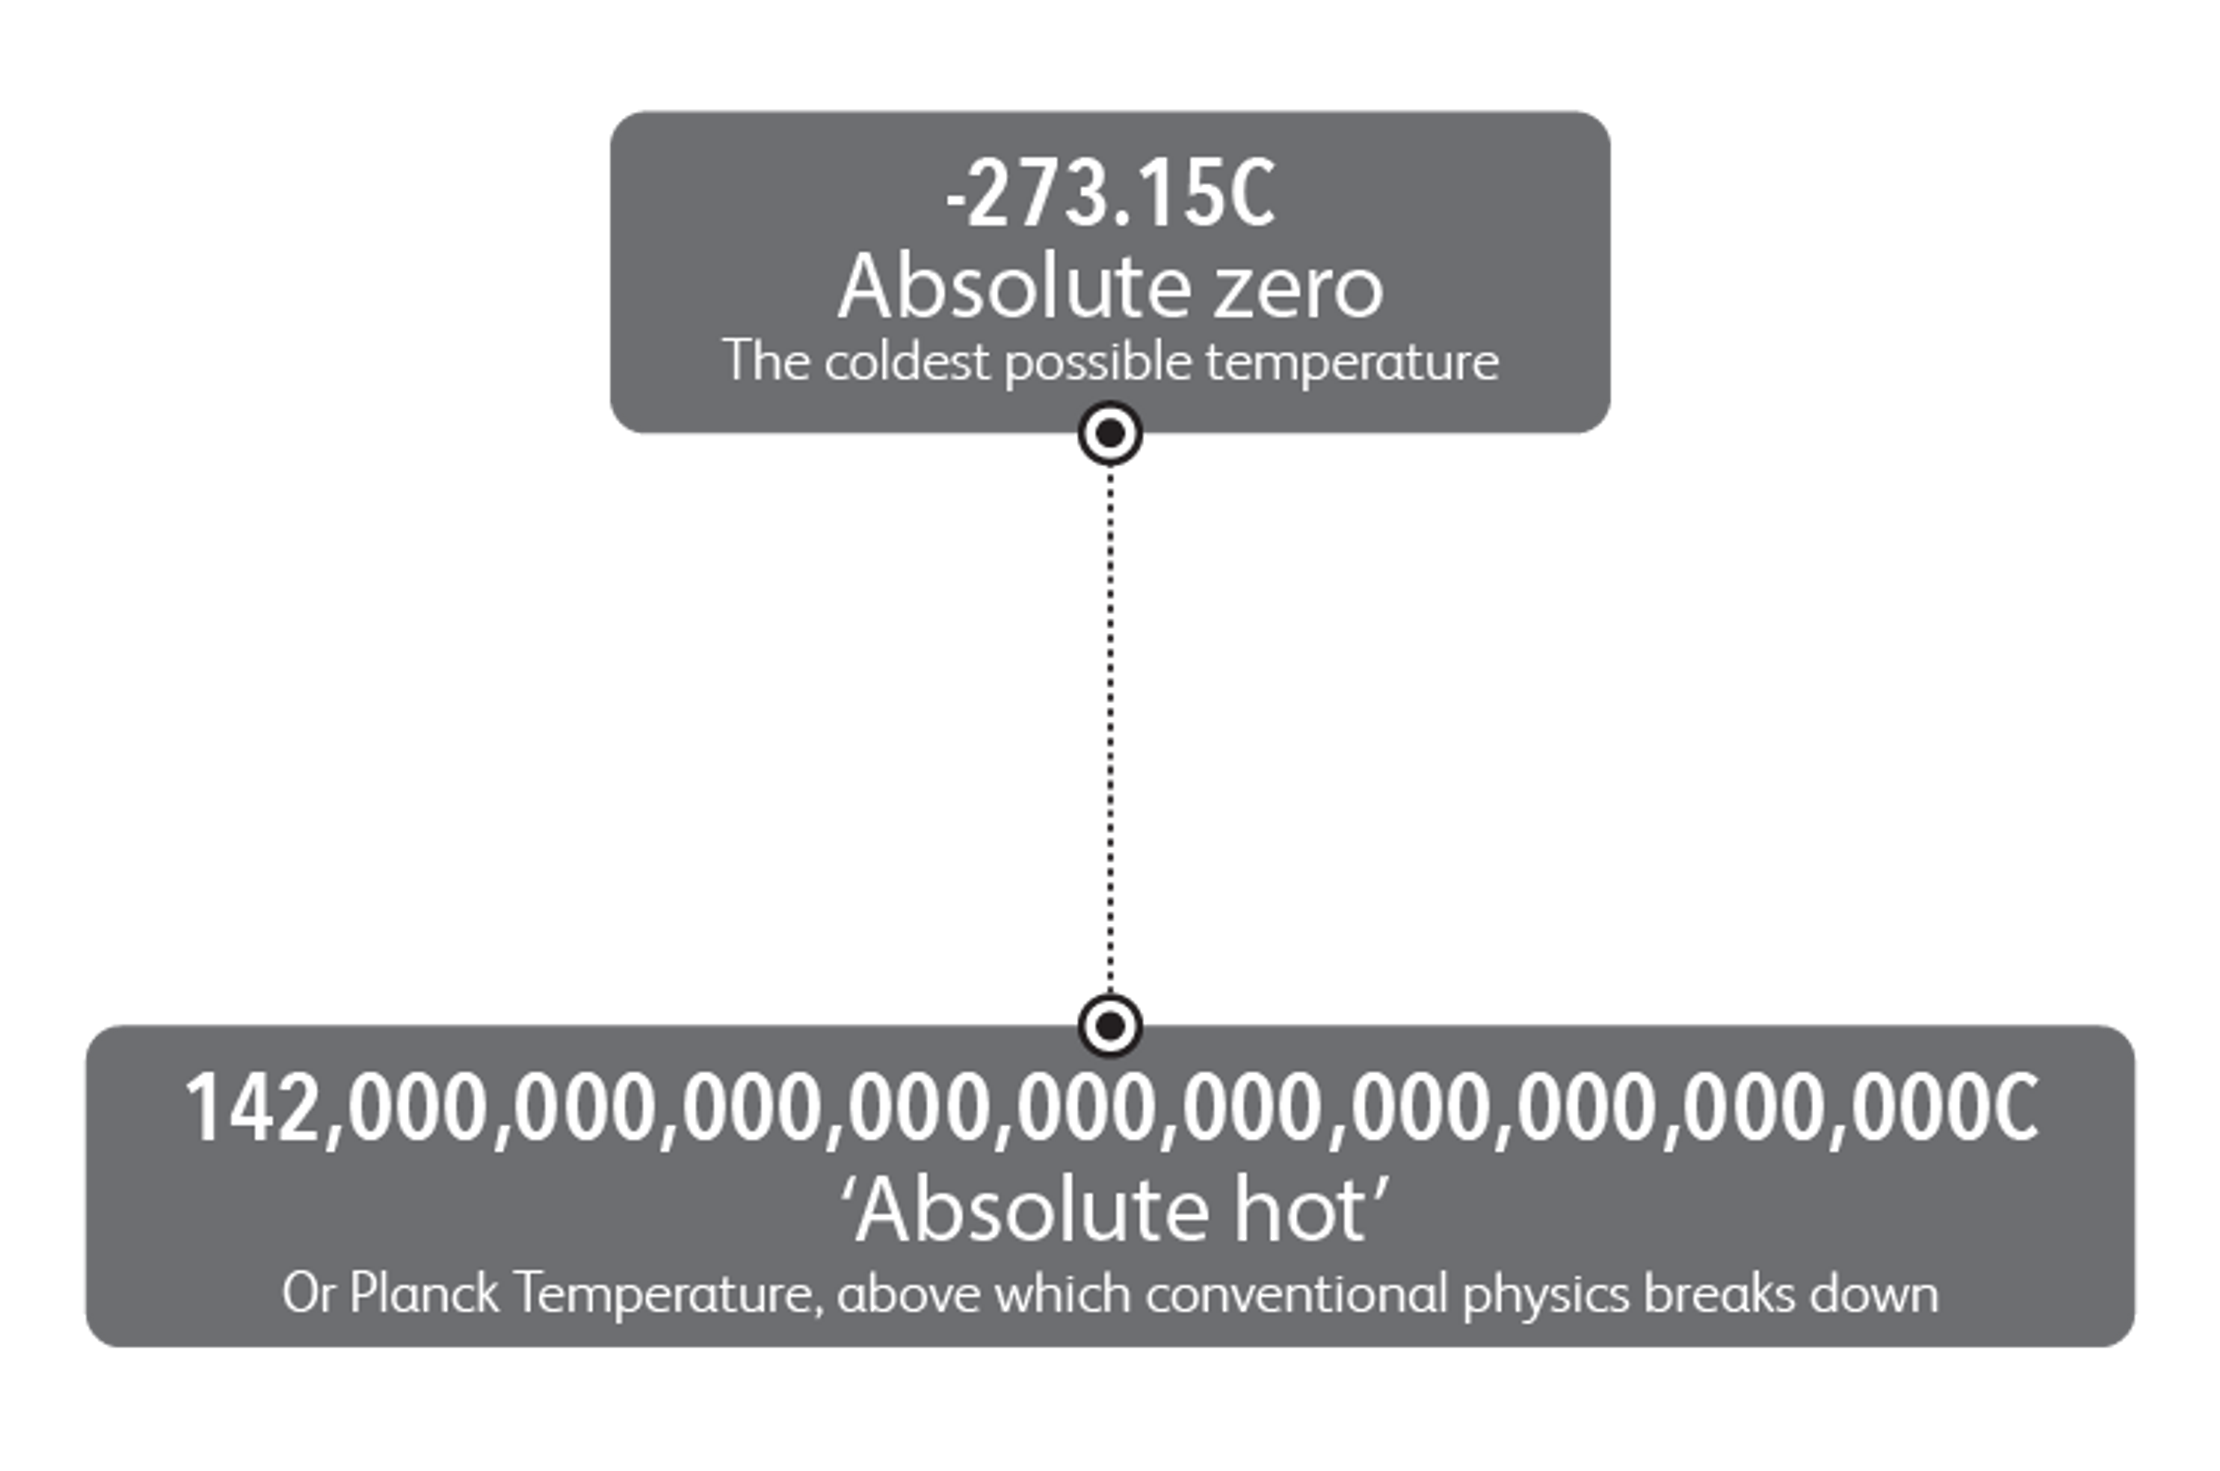
For the colour palette, frosty blues thaw into warm greens that become scorched reds as you descend from absolute zero to absolute hot.


Flipping the script

By themselves, these data points were merely trivia. But they took on real meaning in the context of each other. 

So to create this scale of understanding, we designed our interactive visualization like an inverted thermometer. 

Why the flip? We wanted the story to build to a big finish. Our sub-zero start point is -273°C. But our visualization hots up to 33-digit temperature reading where physics itself breaks down.


Cool comparisons

This gave the piece a structure that helped people to make surprising comparisons for themselves.

Did you know that the Earth’s core (6,000°C) is even hotter than the surface of the sun (5,500)? And both are cool compared to a nuclear explosion (10,000°C)?

How does the lowest temperature on Earth (-93°C) compare to Jupiter’s moons (-139˚C) or the surface of Mars (-87°C)?

Explore the visualization to discover all this and more.