Forecasting the Future

These simple, beautiful explainers reveal the predictive power of the world’s most accurate weather forecasting system.
Client

ECMWF

Project TypeExplainers
A graphic showing a cross section of a landscape with mountains, rivers and the ocean. On that landscape are several circles that magnify ways ECMWF collect weather data like planes, satellites, radar and boats.

For 40 years, the European Centre for Medium-Range Weather Forecasts (ECMWF) has provided us with the world’s most accurate weather predictions. Yet few people realise how this is achieved.

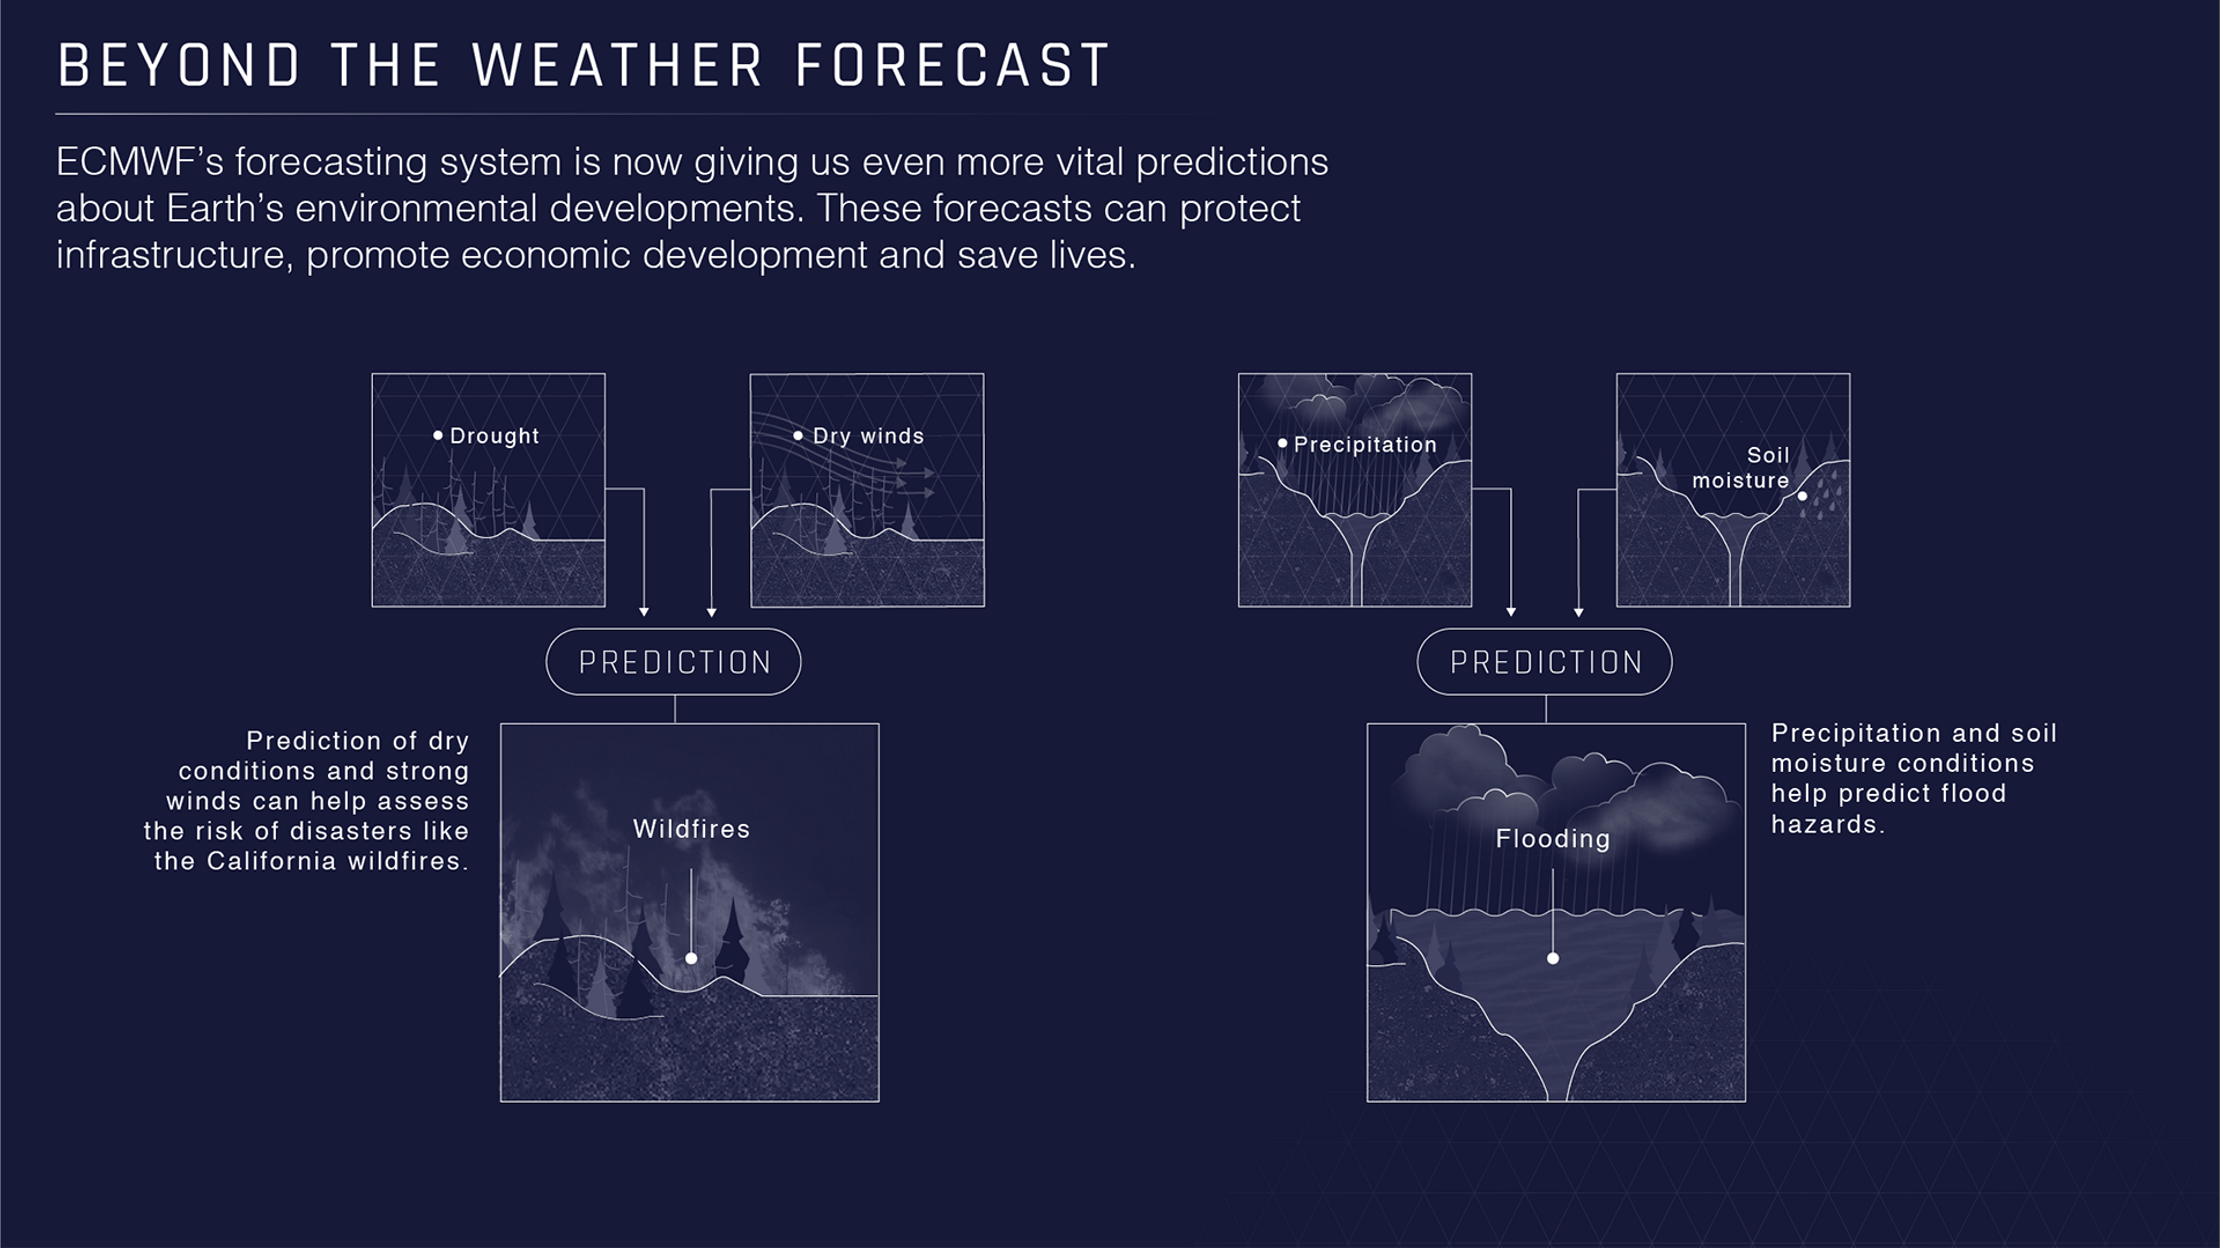
ECMWF asked us to create four explainers, visualizing how its unique forecasting system works. And how the weather isn’t the only thing it helps us predict.

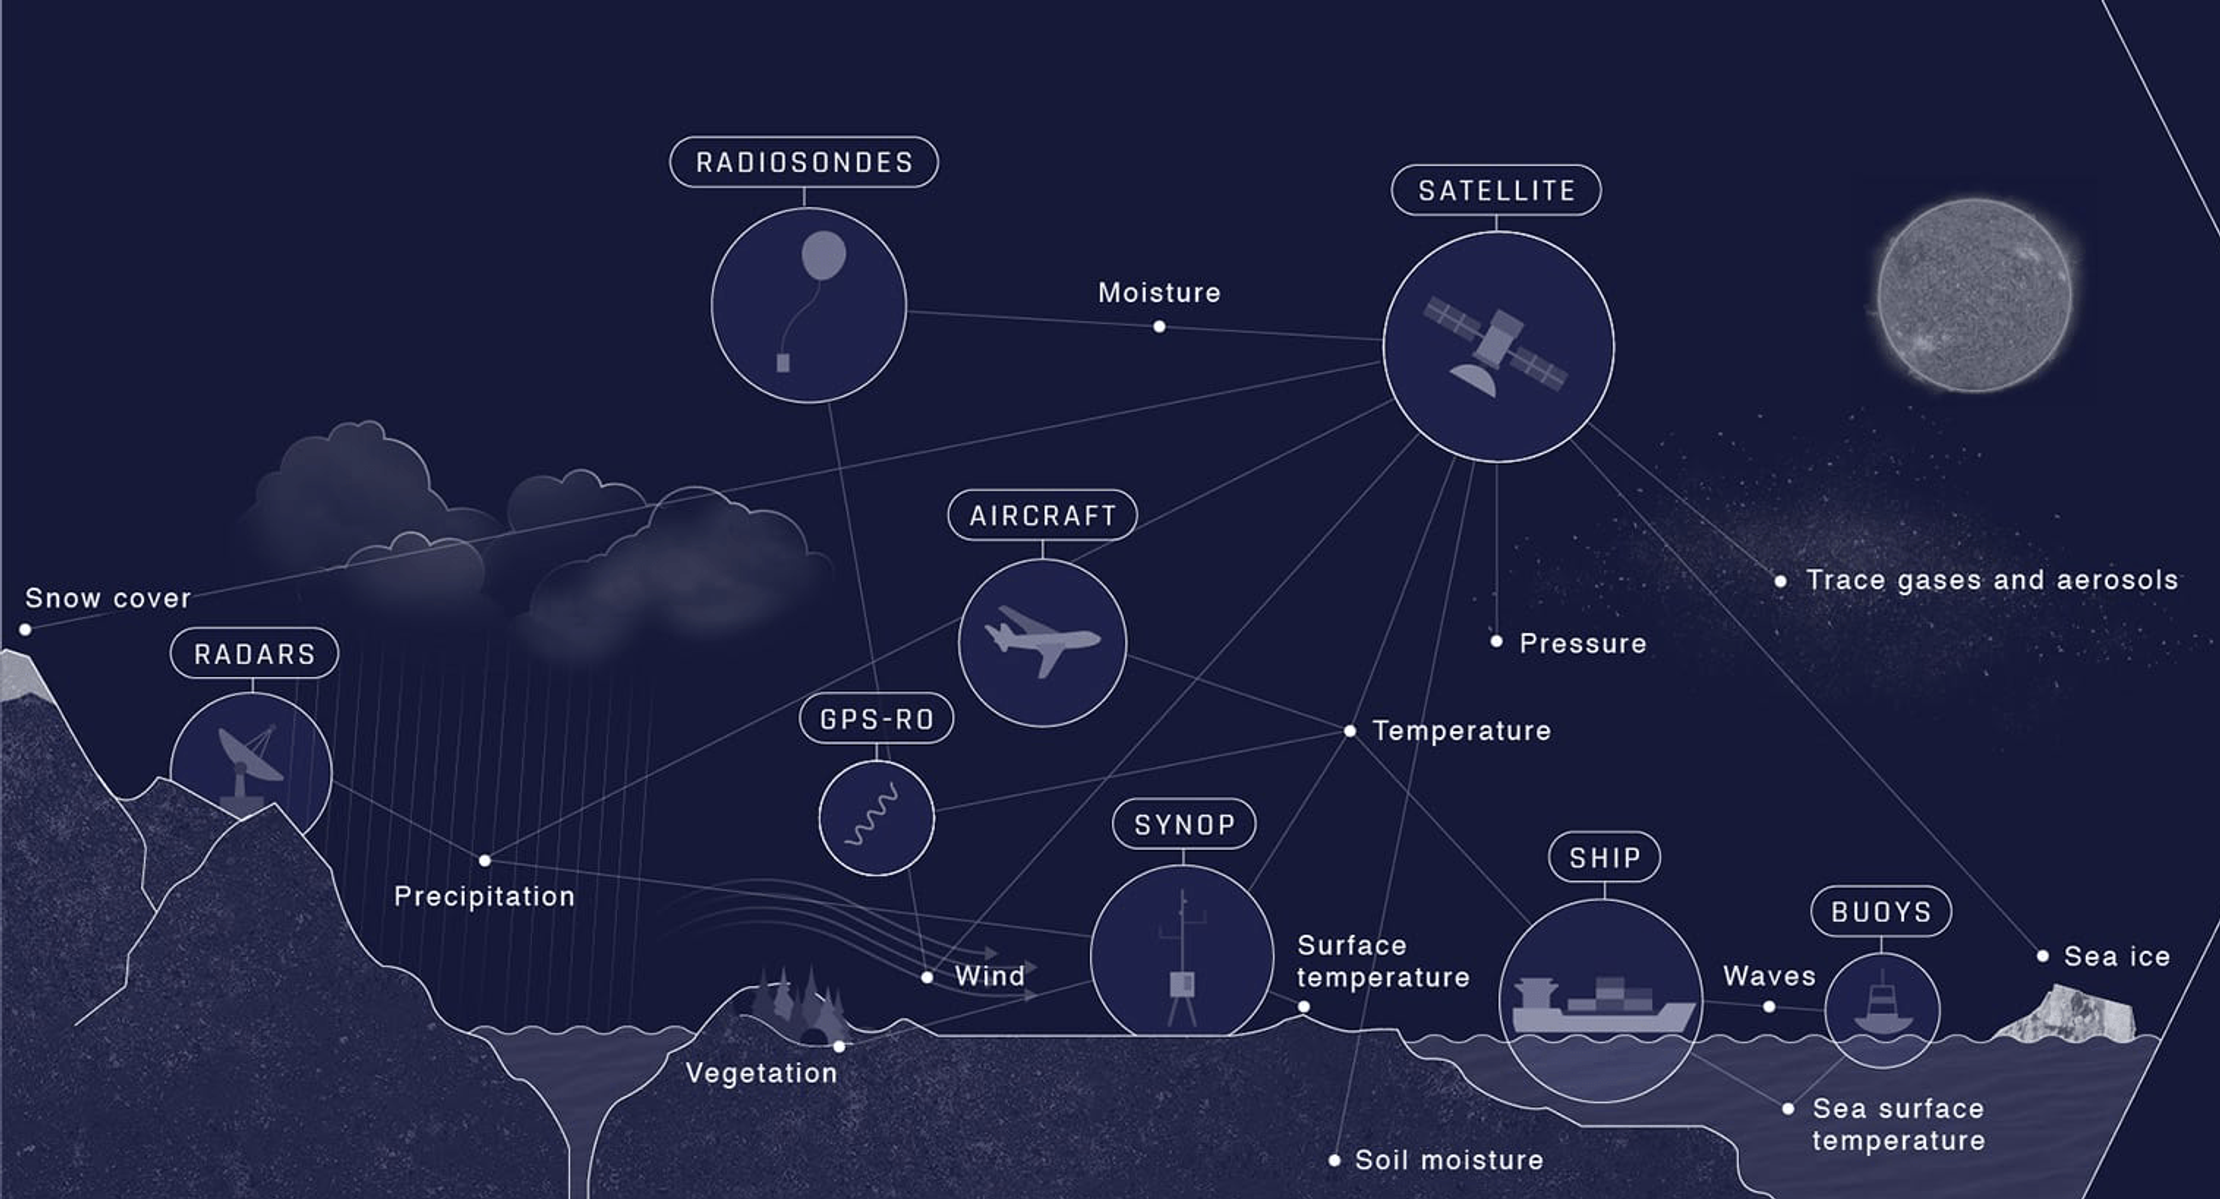
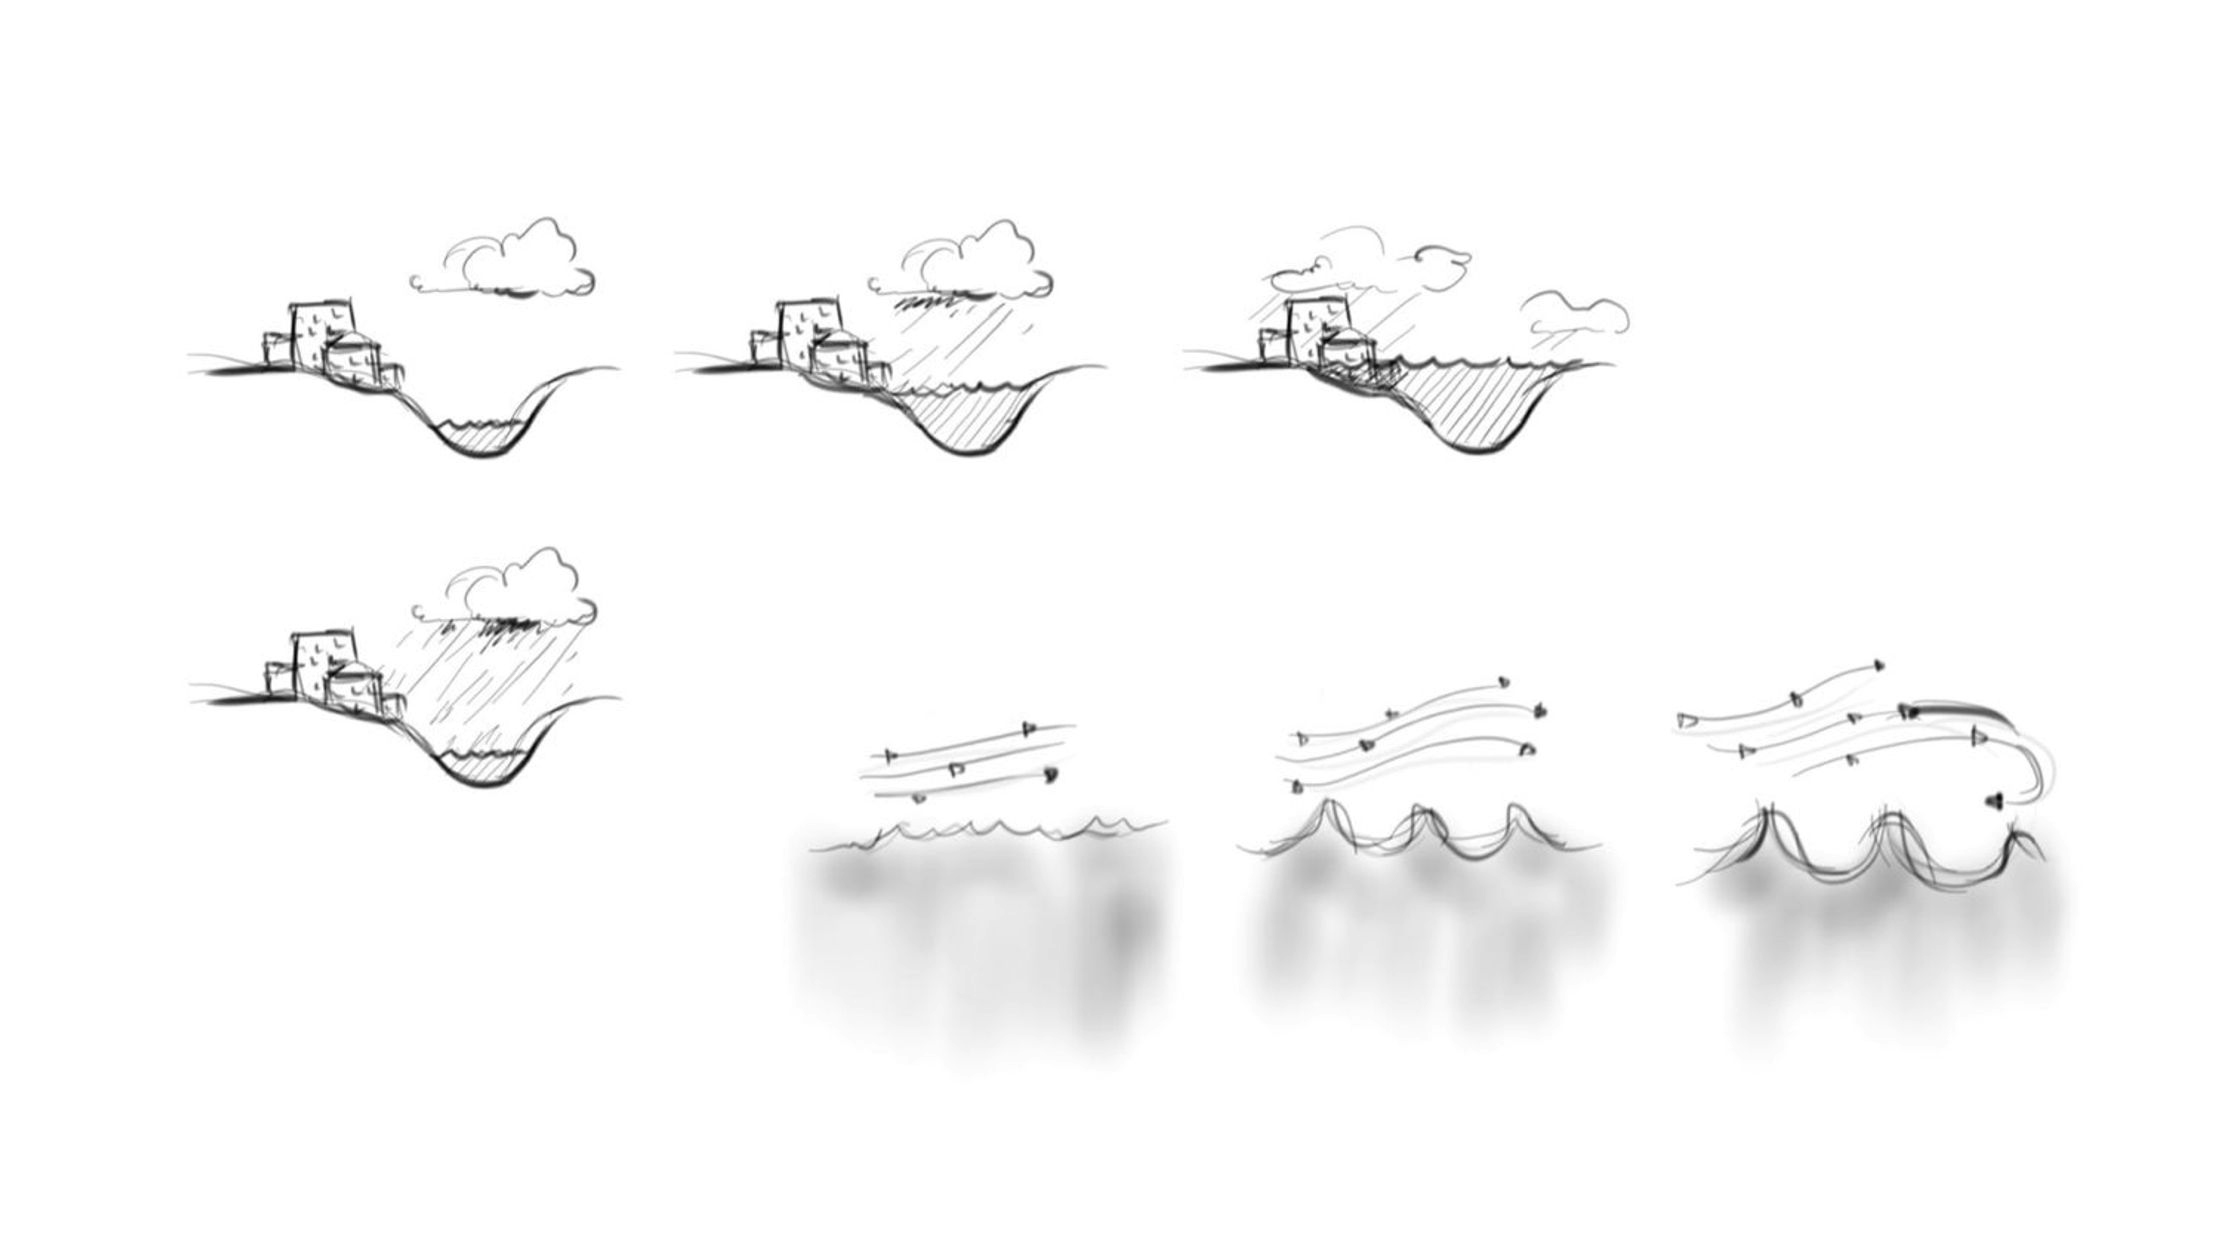
We chose an illustration style that comfortably captured a snapshot of the natural world, one brimming with the weather signals that ECMWF absorbs: from precipitation and evaporation to solar radiation and soil moisture.

We built the story to work as static images, but subtle animated touches such as sea ice gently rocking on the waves helped to highlight the environmental forces at work.

Simple visual examples illustrated how this virtual Earth reveals the interconnectedness of our real one. Cold and warm air over the Carribean creates a tornado. A hurricane over the Atlantic ocean impacts the weather in Europe a few days later.

This suite of visualizations was launched at the AGU centennial conference in San Francisco, the largest international Earth and space science meeting in the world.

On the big screen and social media, they helped leading scientists and members of the public gain a new appreciation and understanding of ECMWF’s innovative, world-changing work.

An animated cross section of a landscape with a river, clouds in the sky and a portion of ocean. It's covered in labels for data points ECMWF tracks to forecast the weather and climate. They includ snow cover, solar radiation, sea ice, wind, precipitation and many others. Text on the right of the graphic reads '600 million daily observations'.
A sketch of how to draw cross sections of weather for the ECMWF graphics. One sketch shows the progression of cloud and rain over a city by a river. The other shows wind patterns whipping up waves on water.
A sketch with a white brush on a dark background of a full landscape cross section. The sketch shows various parts of the climate that ECMWF monitors, from solar radiation to wind and rain.
An animated graphic of a landscape cross section. Four boxes along the landscape explain the insights ECMWF offers which include: Agricultural, transport, renewable energu planning and shipping forecasts.
An animated graphic showing the Earth with different boxes showing how ECMWF takes present day data and builds it into forecasts for events like tornadoes, waves and hurricanes.
An animated graphic titled 'Beyond the Weather Forecast.' It shows how indicators like drought and dry winds can predict wildfires or precipitation and soil moisture can lead to flooding. It emphasises the value of ECMWF data in protecting us all against climate change.

Get in touch:hello@beyondwordsstudio.com
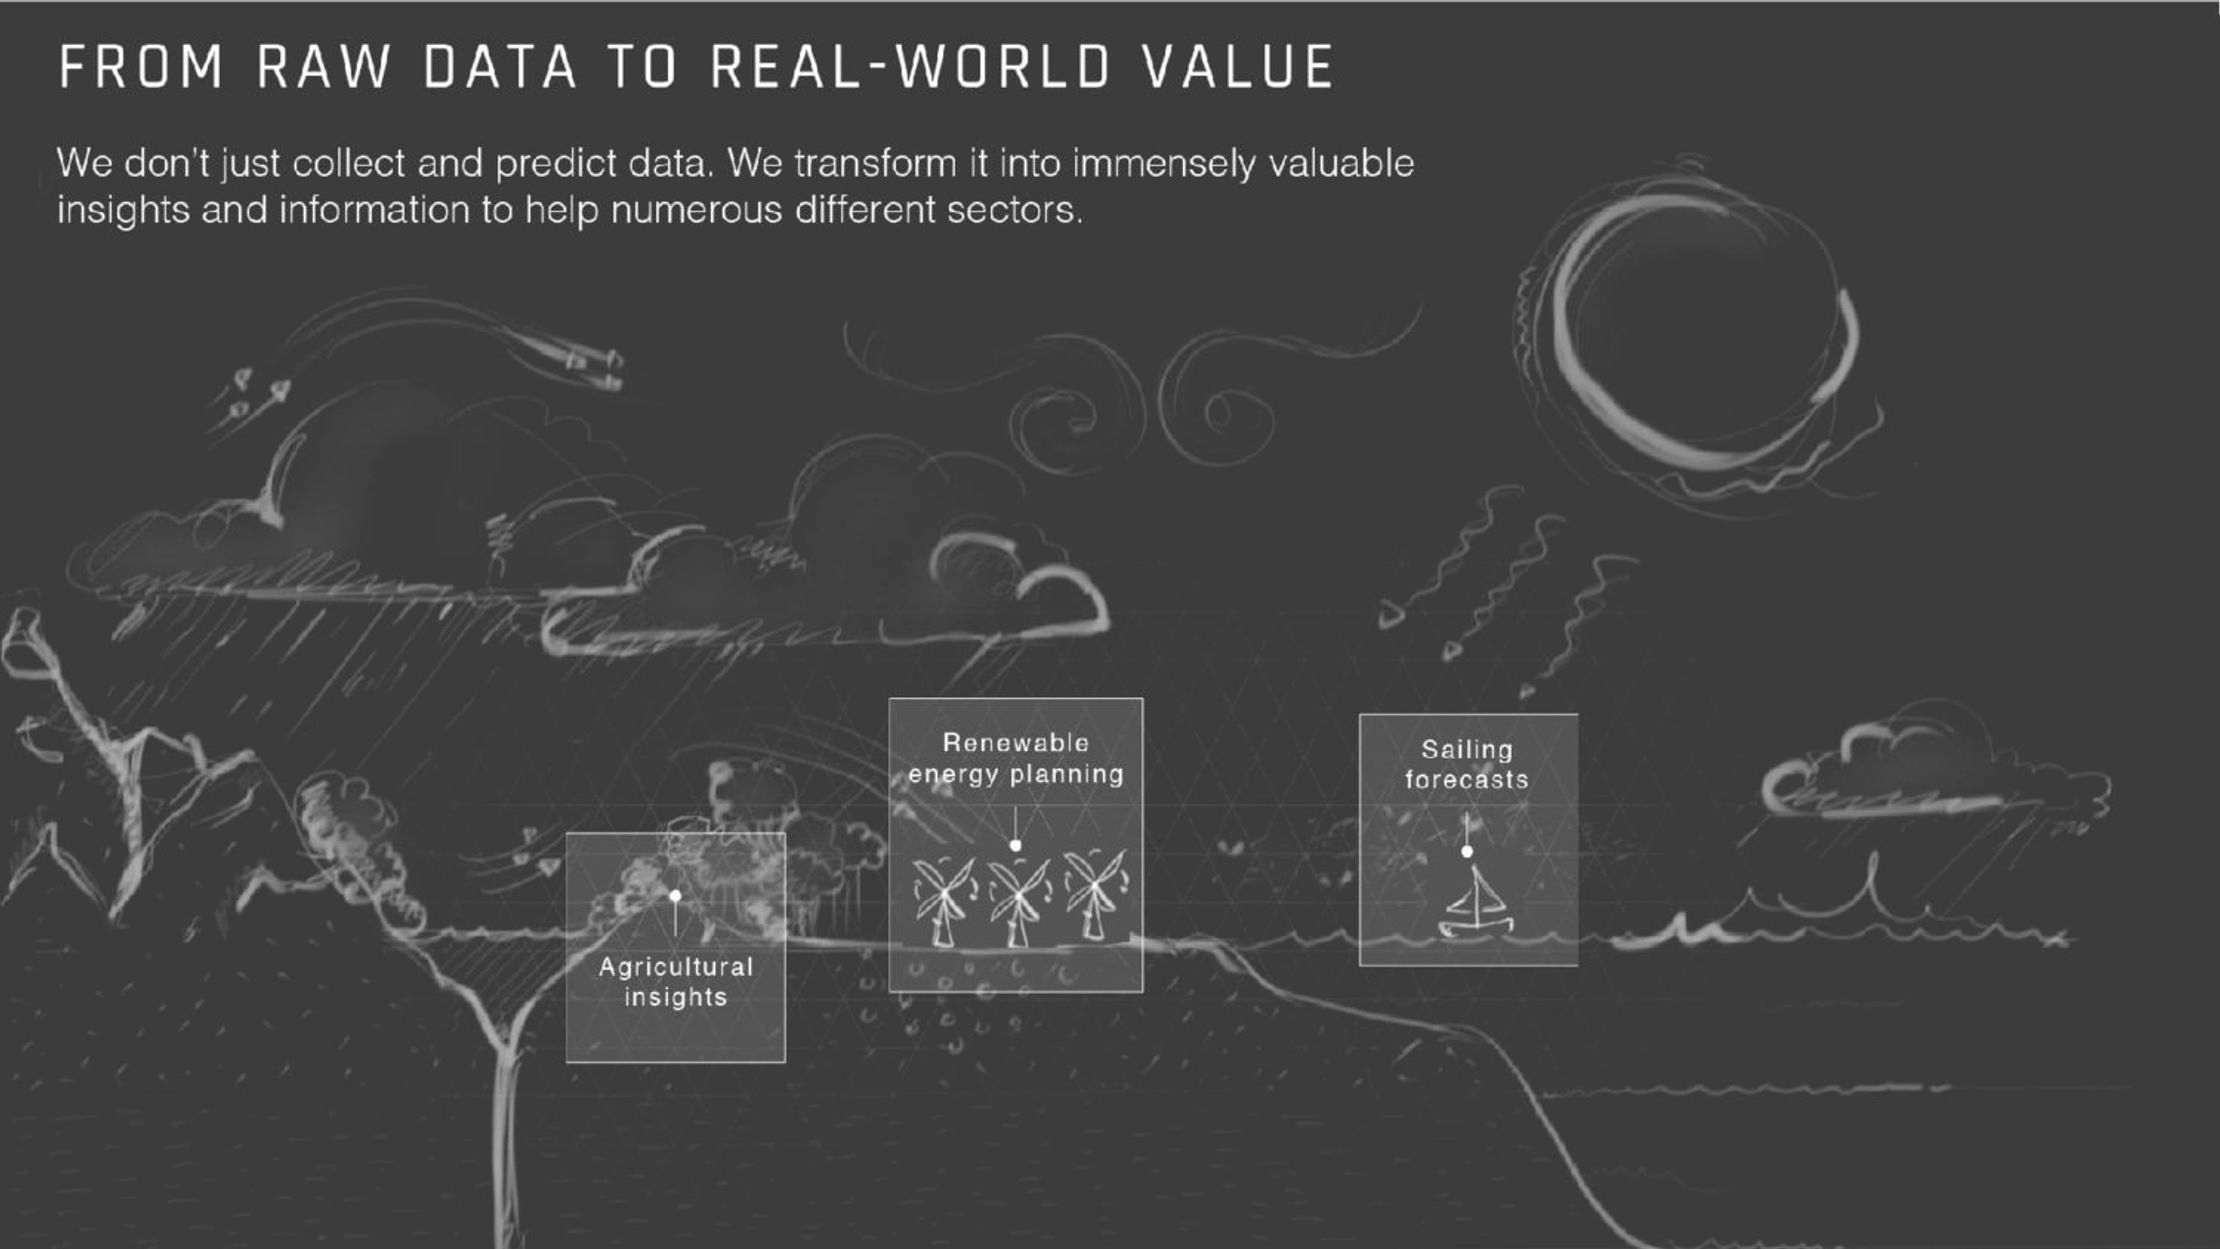
beyond words logo
Follow us
TwitterInstagramLinkedInYouTube
Find us
Beyond Words Studio UK 91 Brick Lane London, E1 6QL
Beyond Words Studio US Florida, USA
Beyond Words Studio EU Dublin, Ireland
Copyright Beyond Words Studio Ltd. 2023