BBC Future
We started with obvious clichés. Grumbling about public transport, the weather... or tea. Then we looked at more positive stereotypes, too – like do non-Brits really believe we have a castle on every corner?
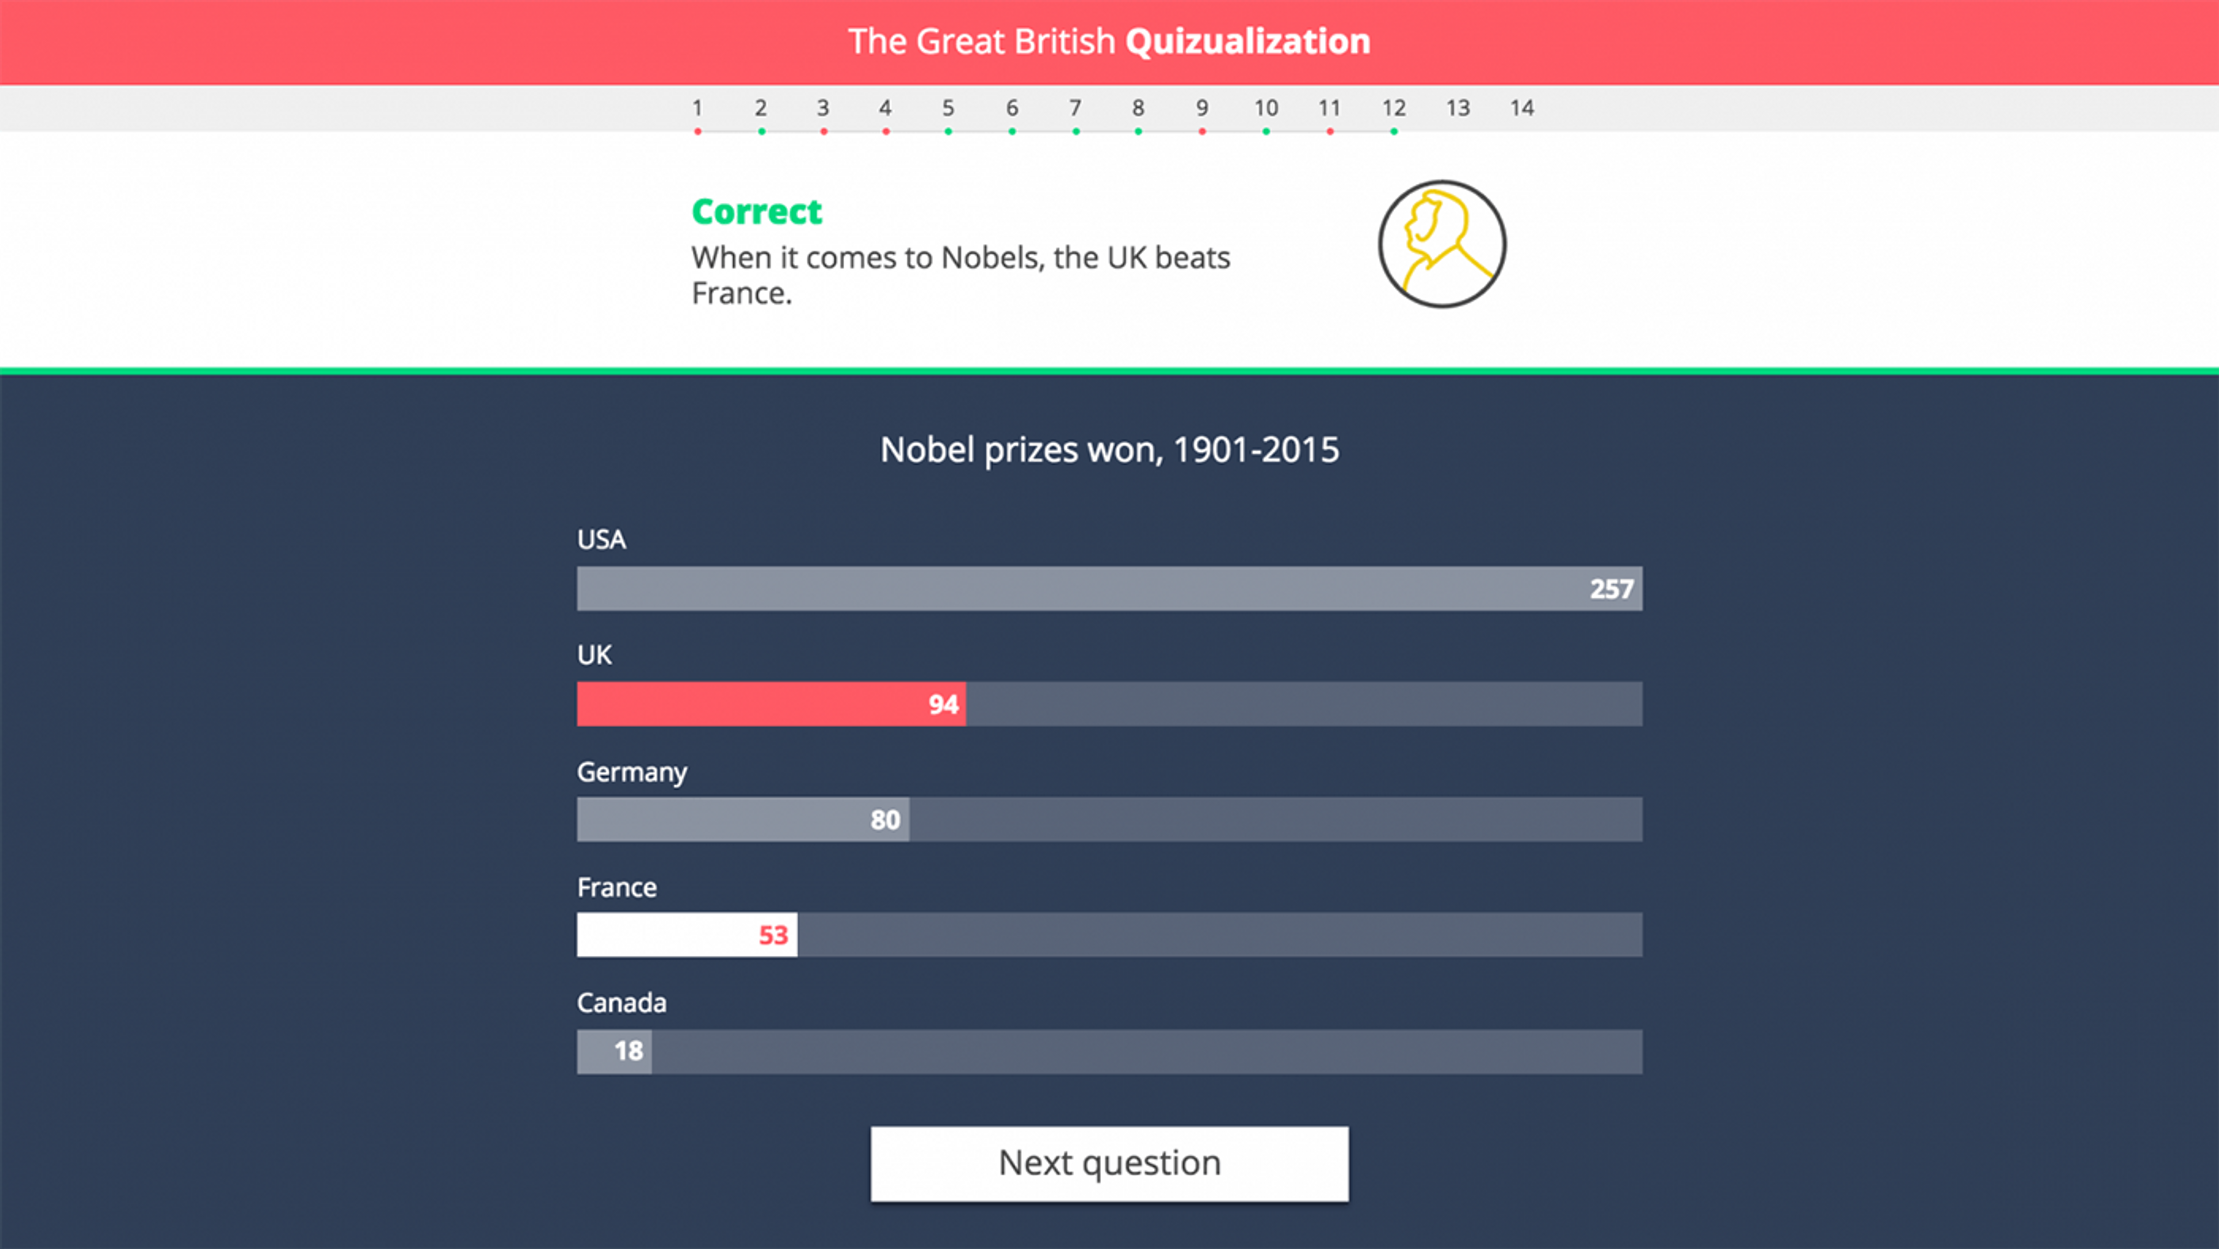
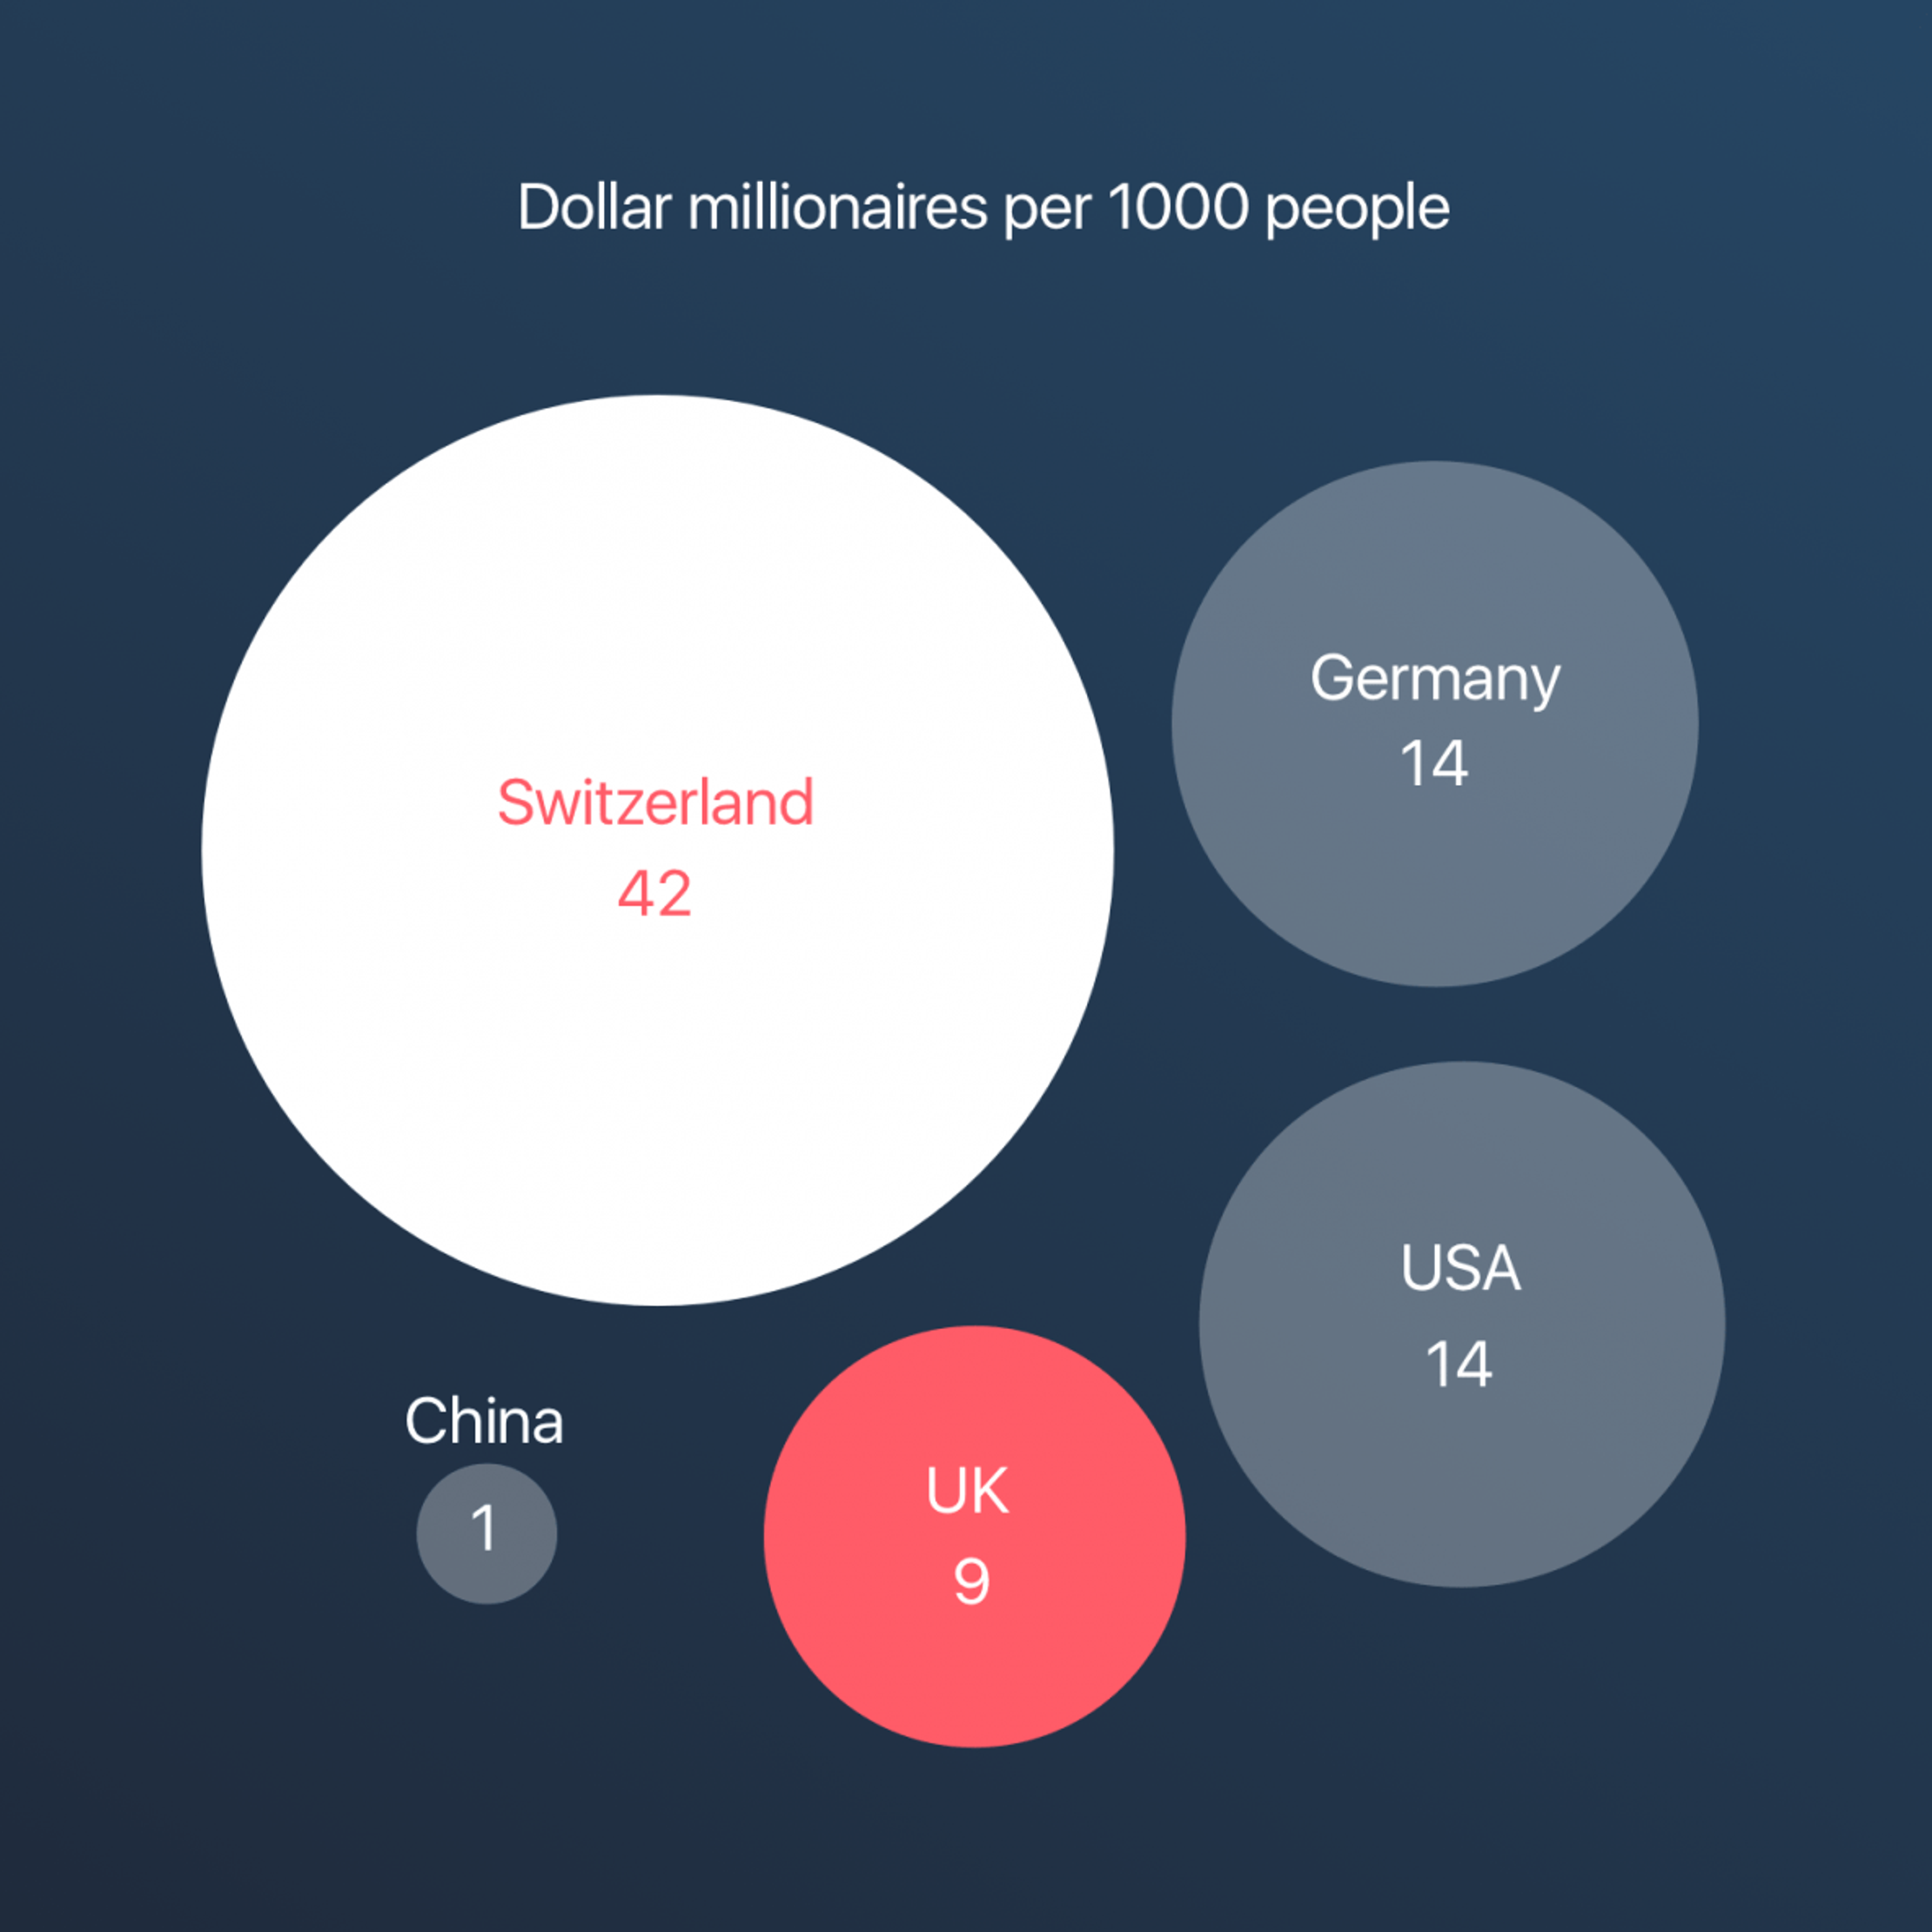
We wanted the results to feel surprising. So, we also considered how Brits might fare in other areas, such as wine drinking, Nobel Peace Prizes won and millionaires nationwide.
From the data, we chose 14 sets that would reveal the most surprising stories.
For the quiz mechanic, we took inspiration from classic Saturday night quiz shows like ‘Deal or no deal’ and ‘Play your cards right’.
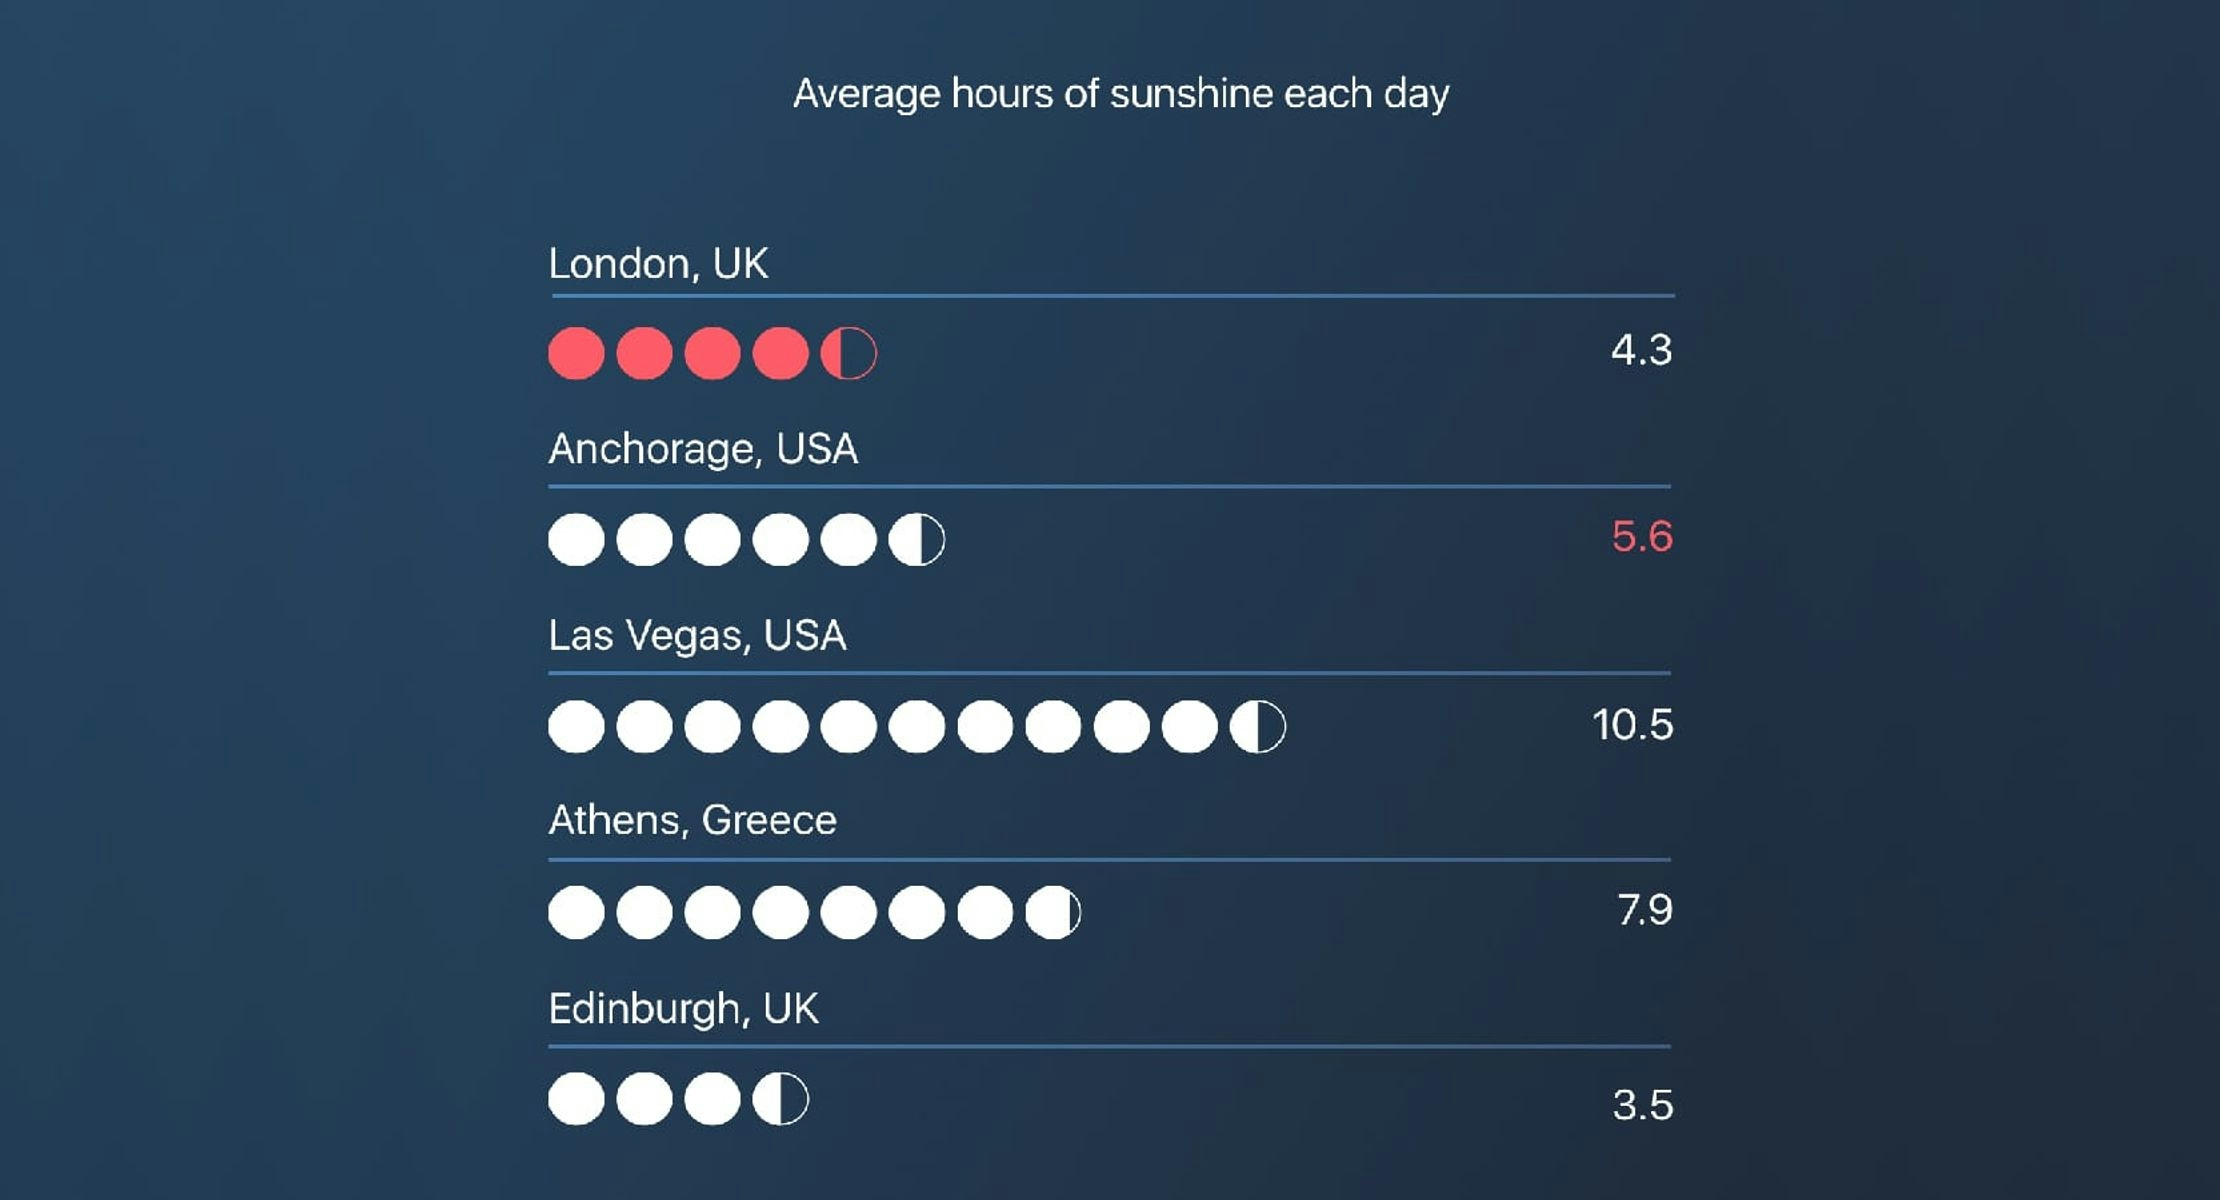
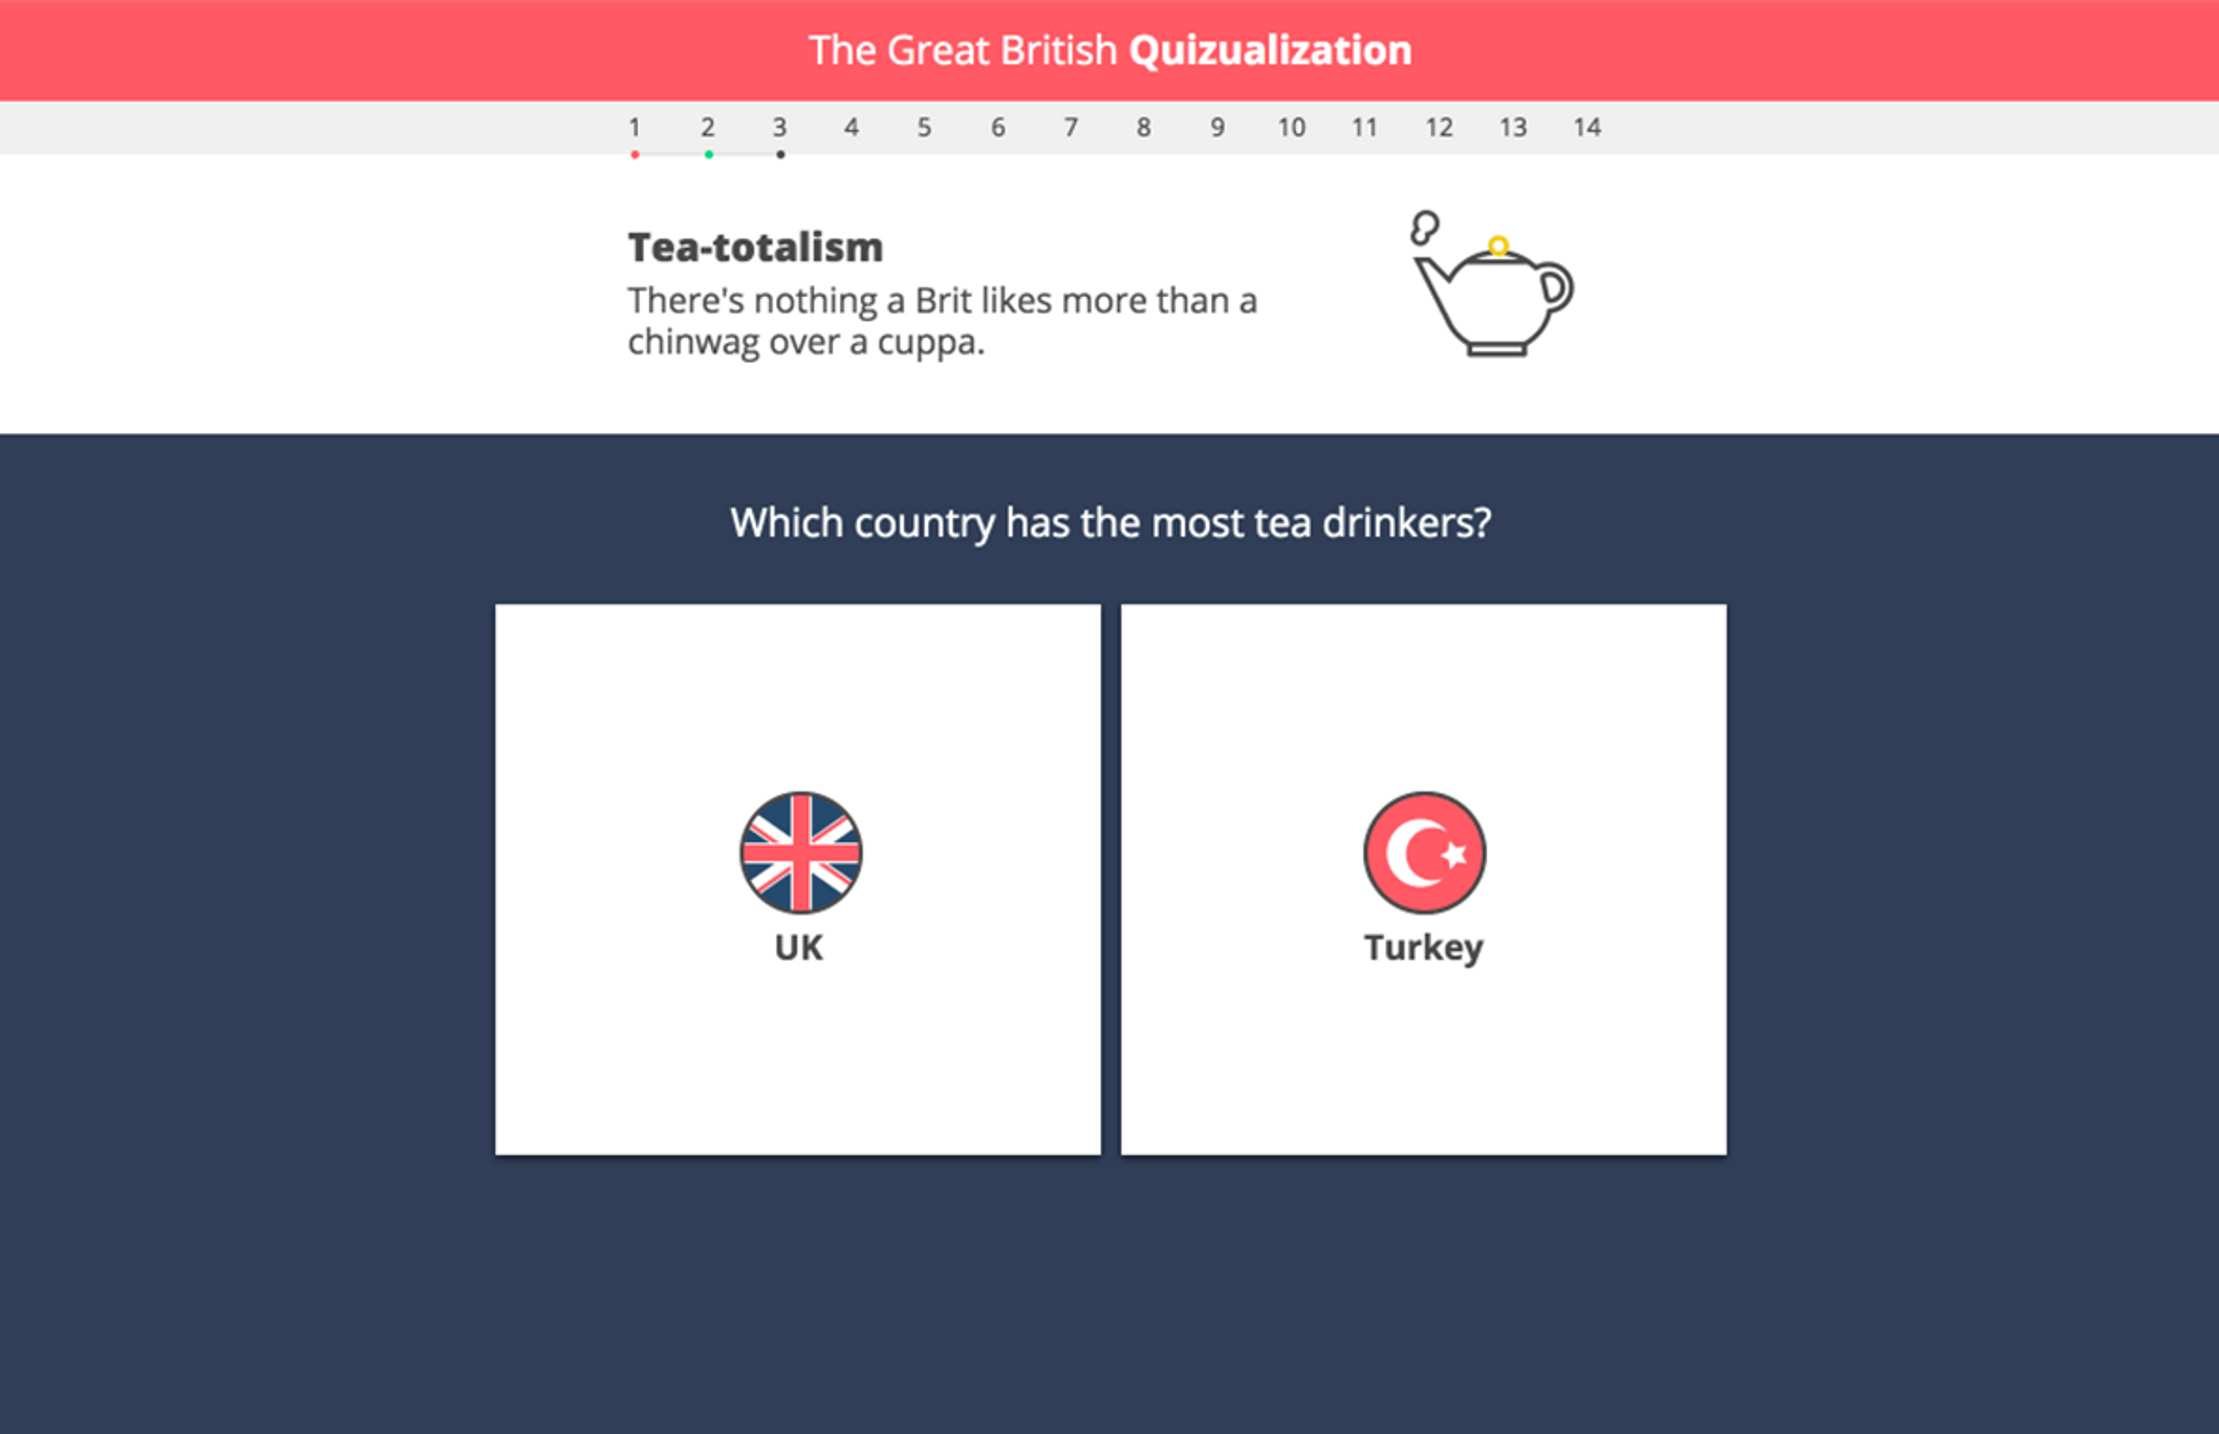
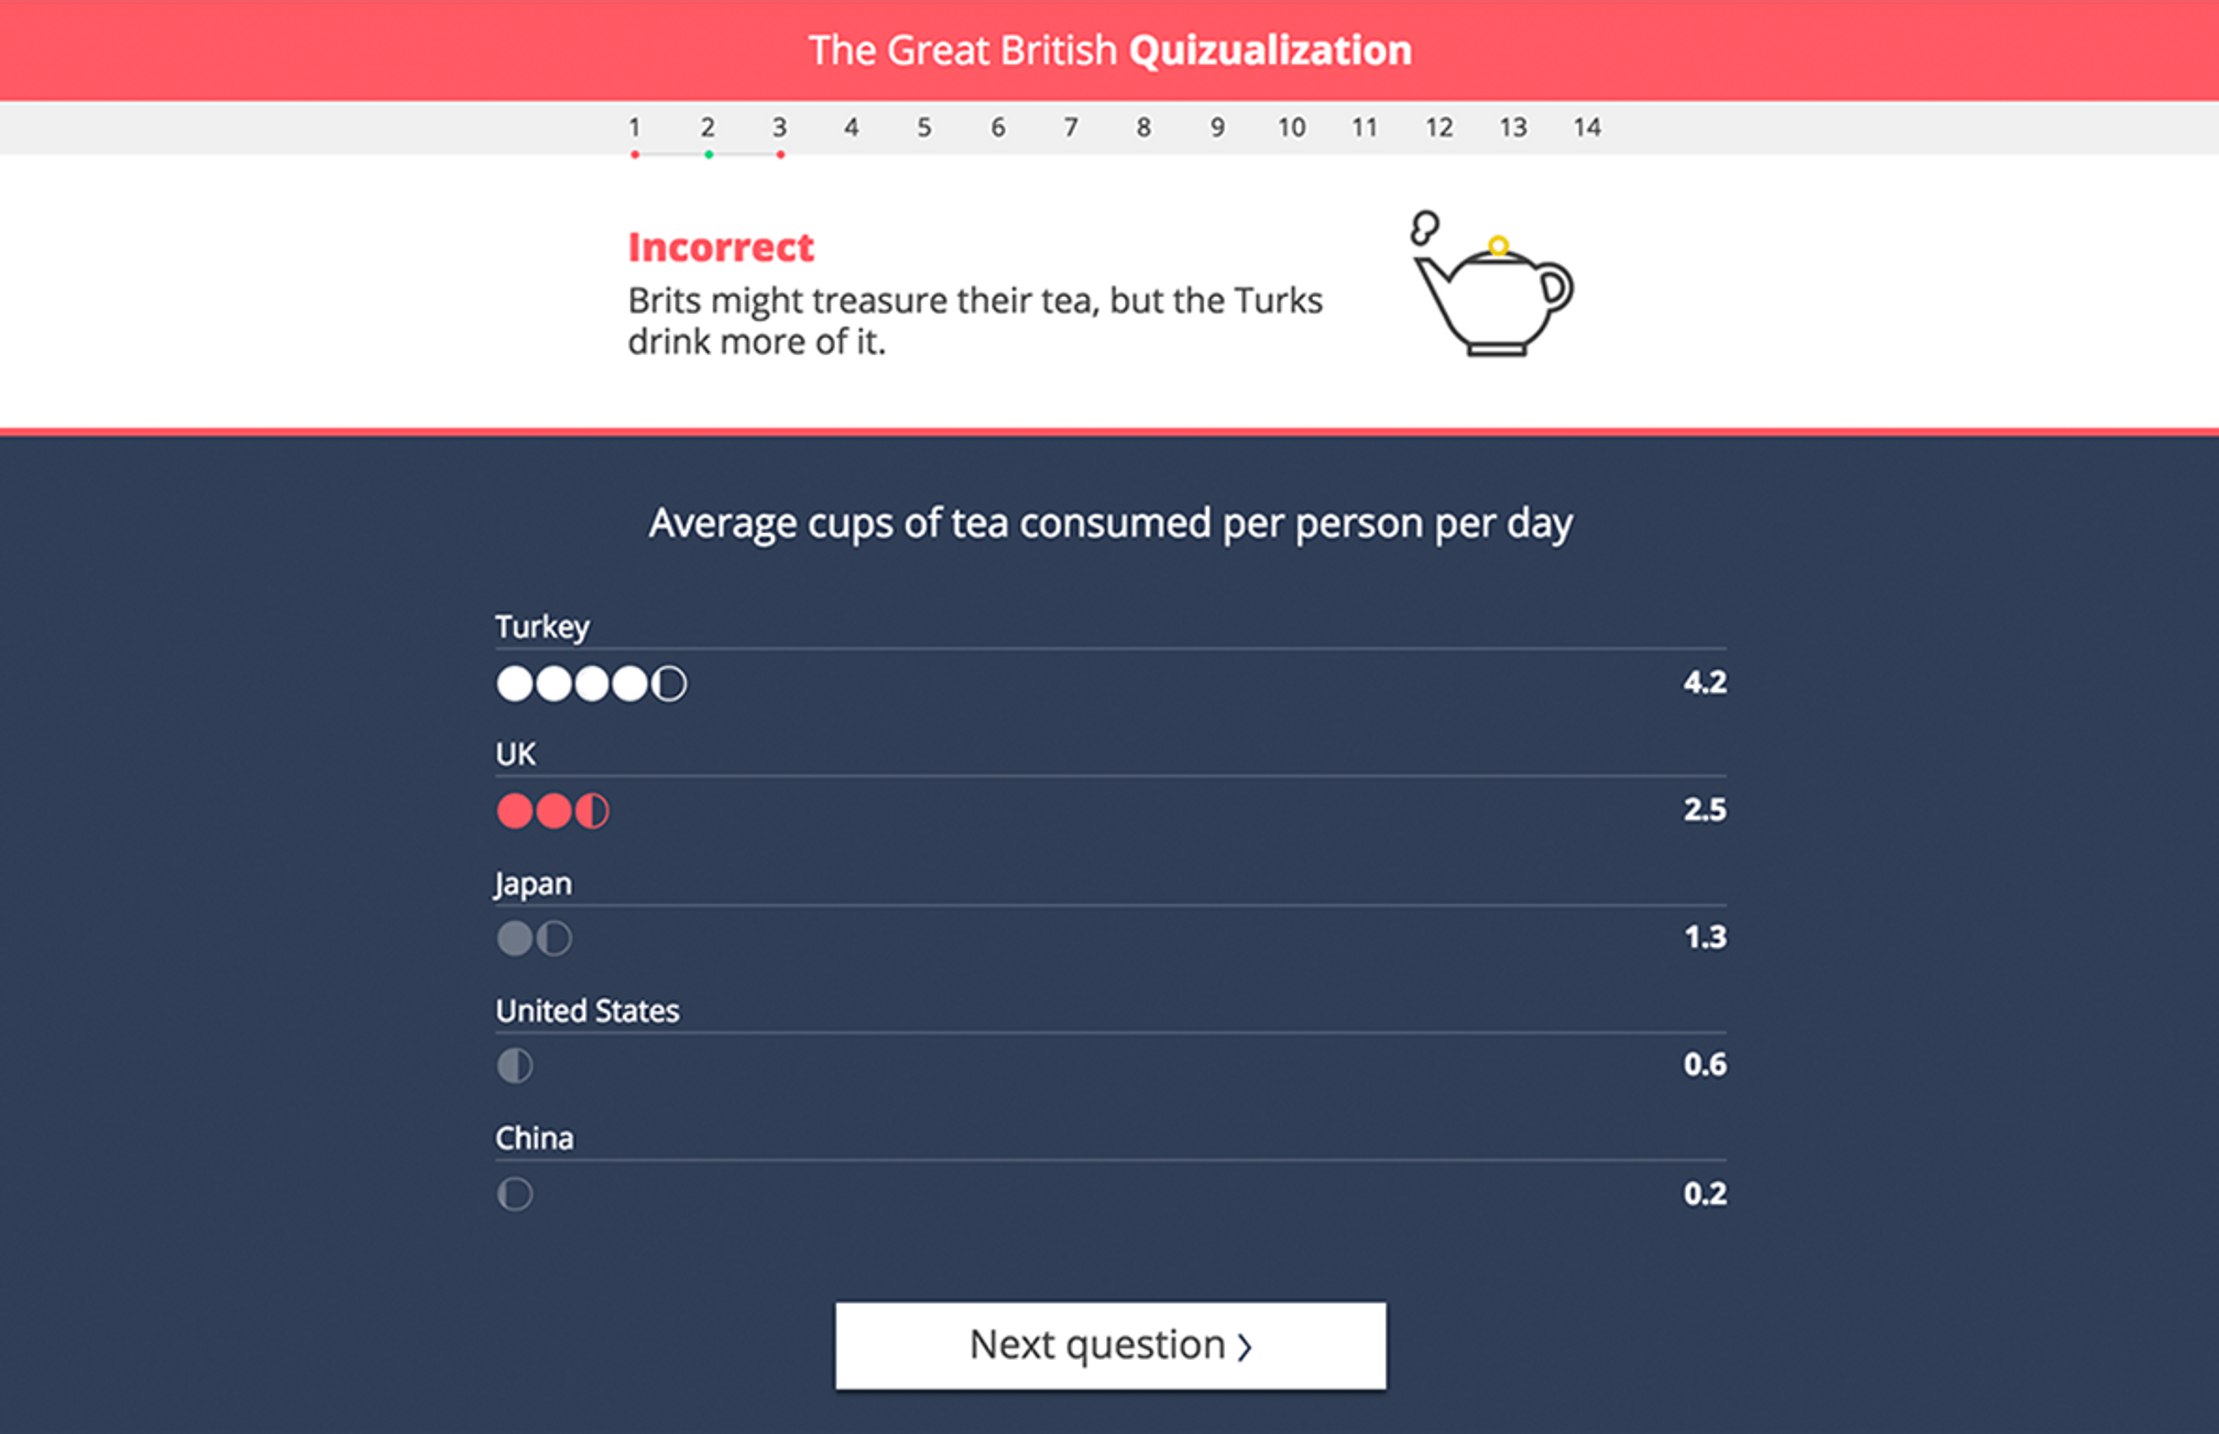
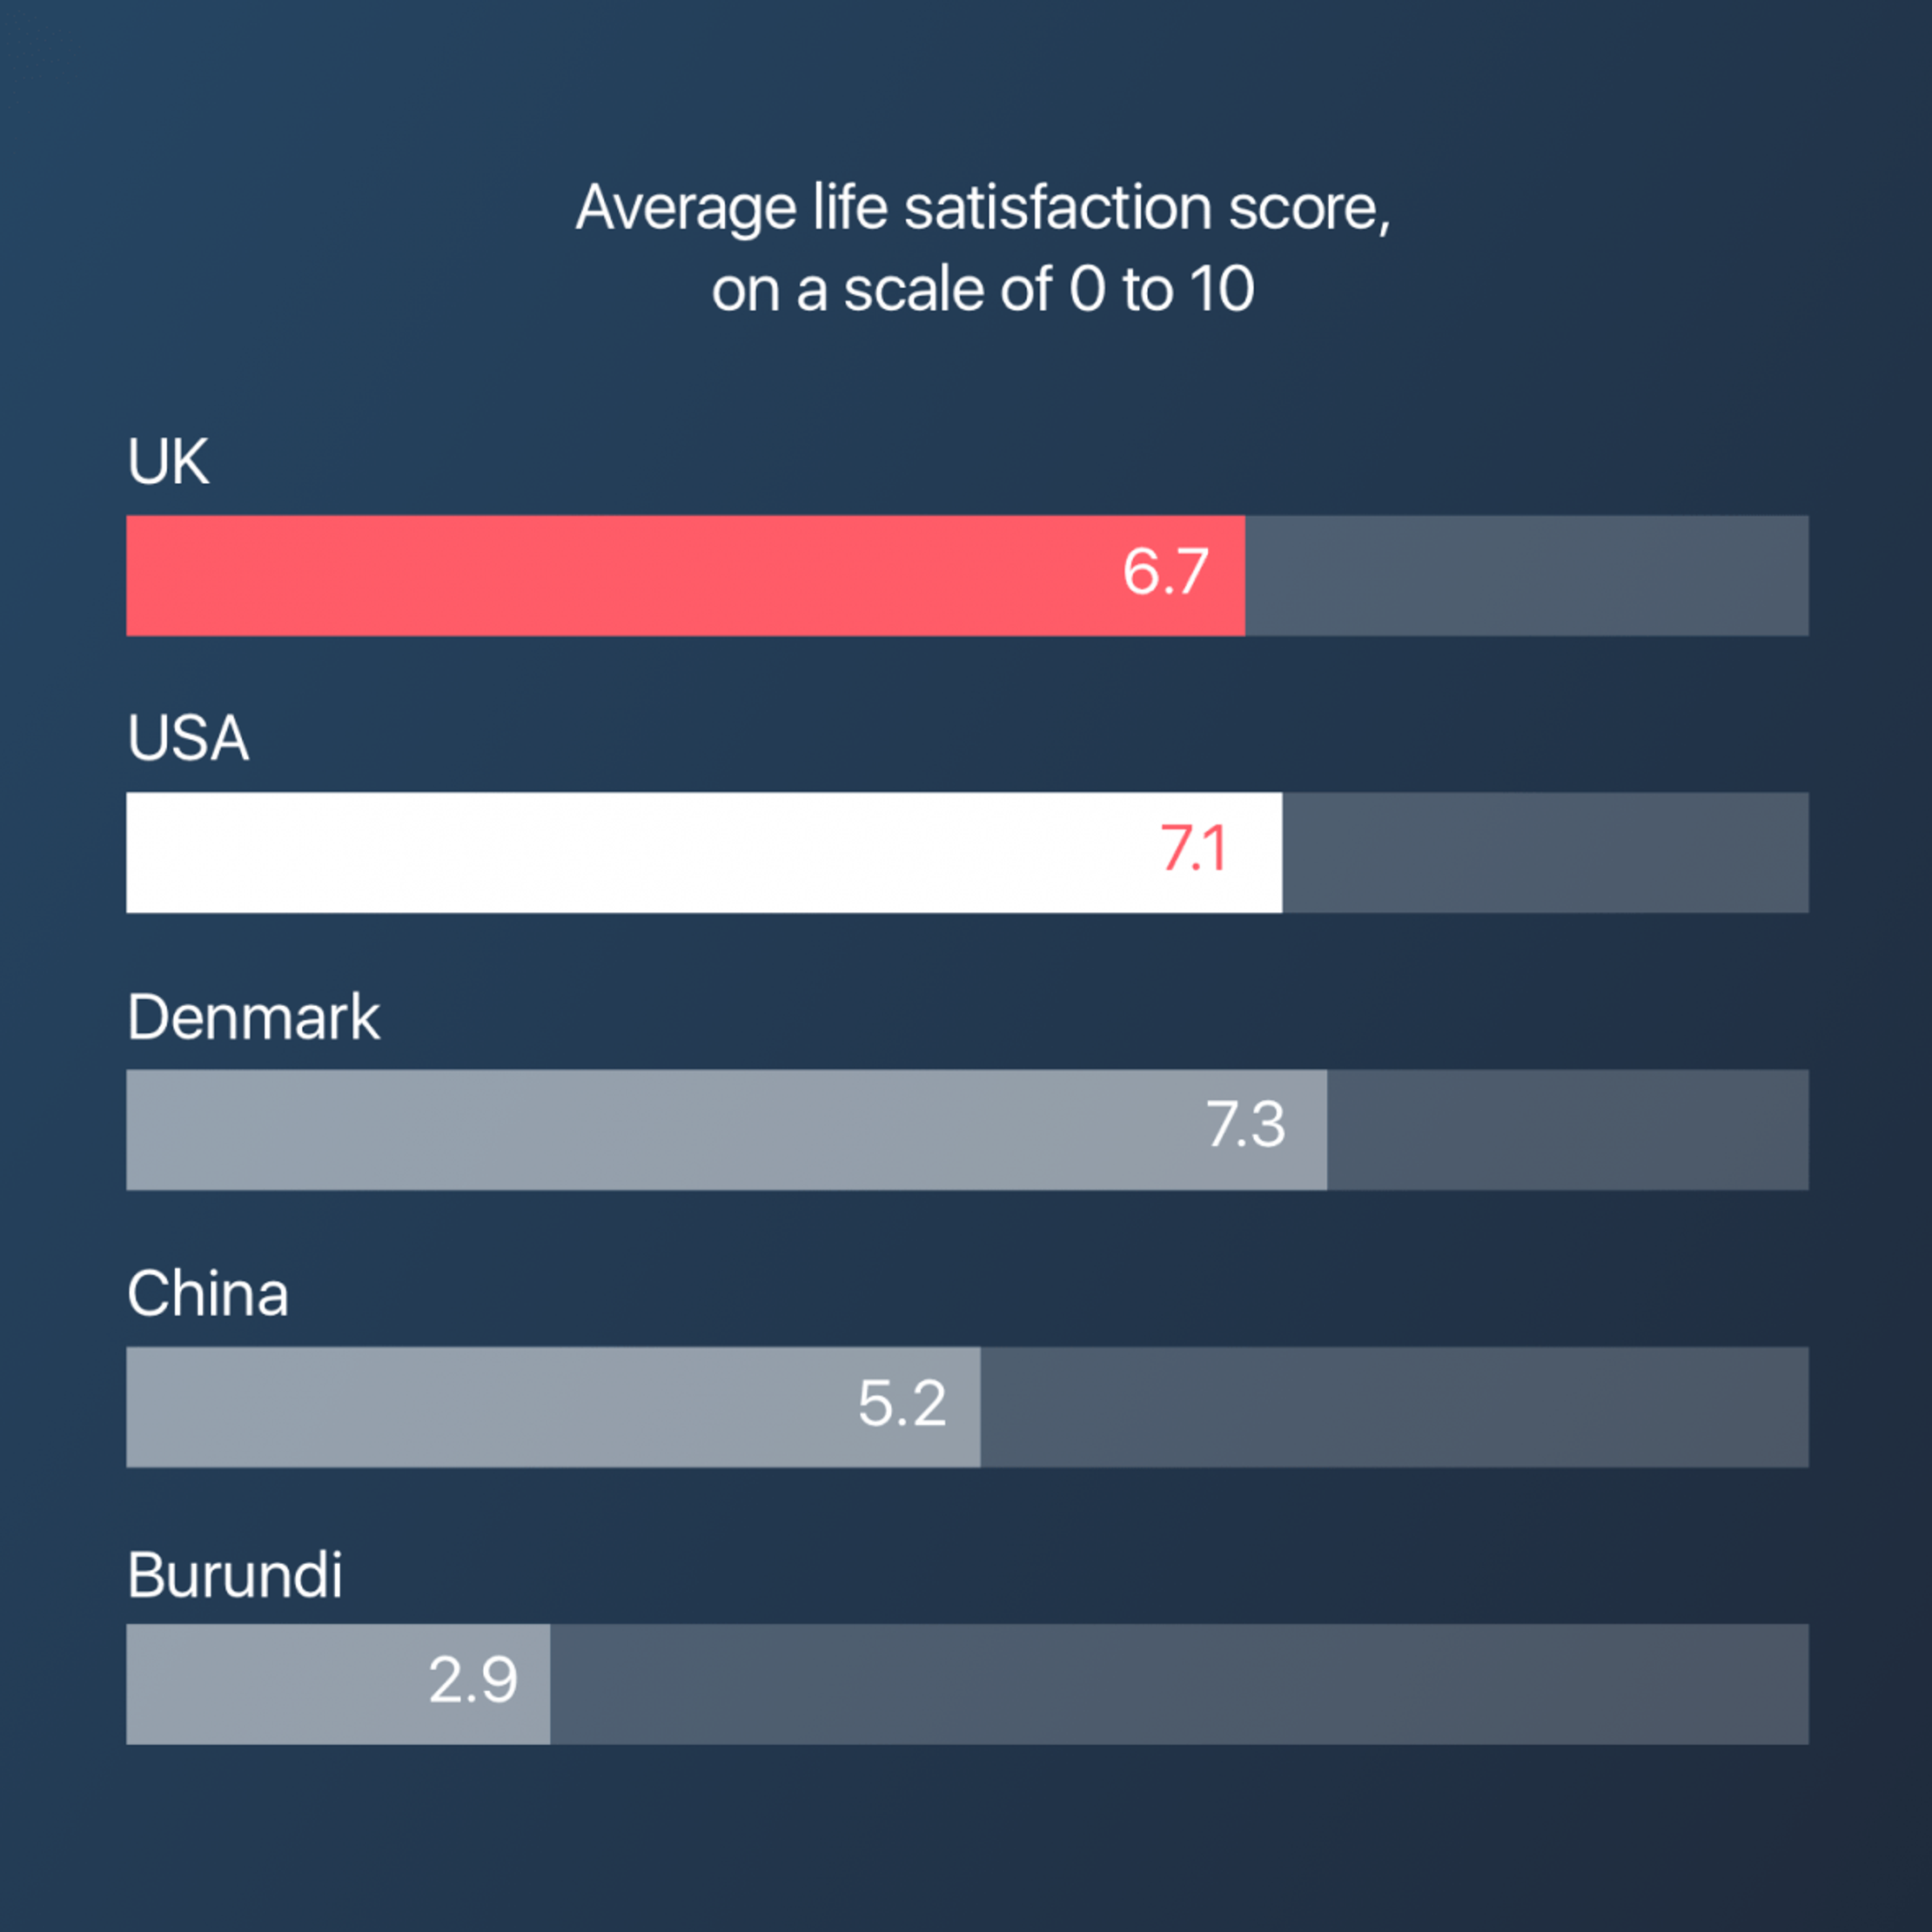
This gave the questions a binary structure, like: which country receives more rain each year – New Zealand or the UK? And from bubble charts to bars, we supplemented each answer with a clean, concise data visualization.
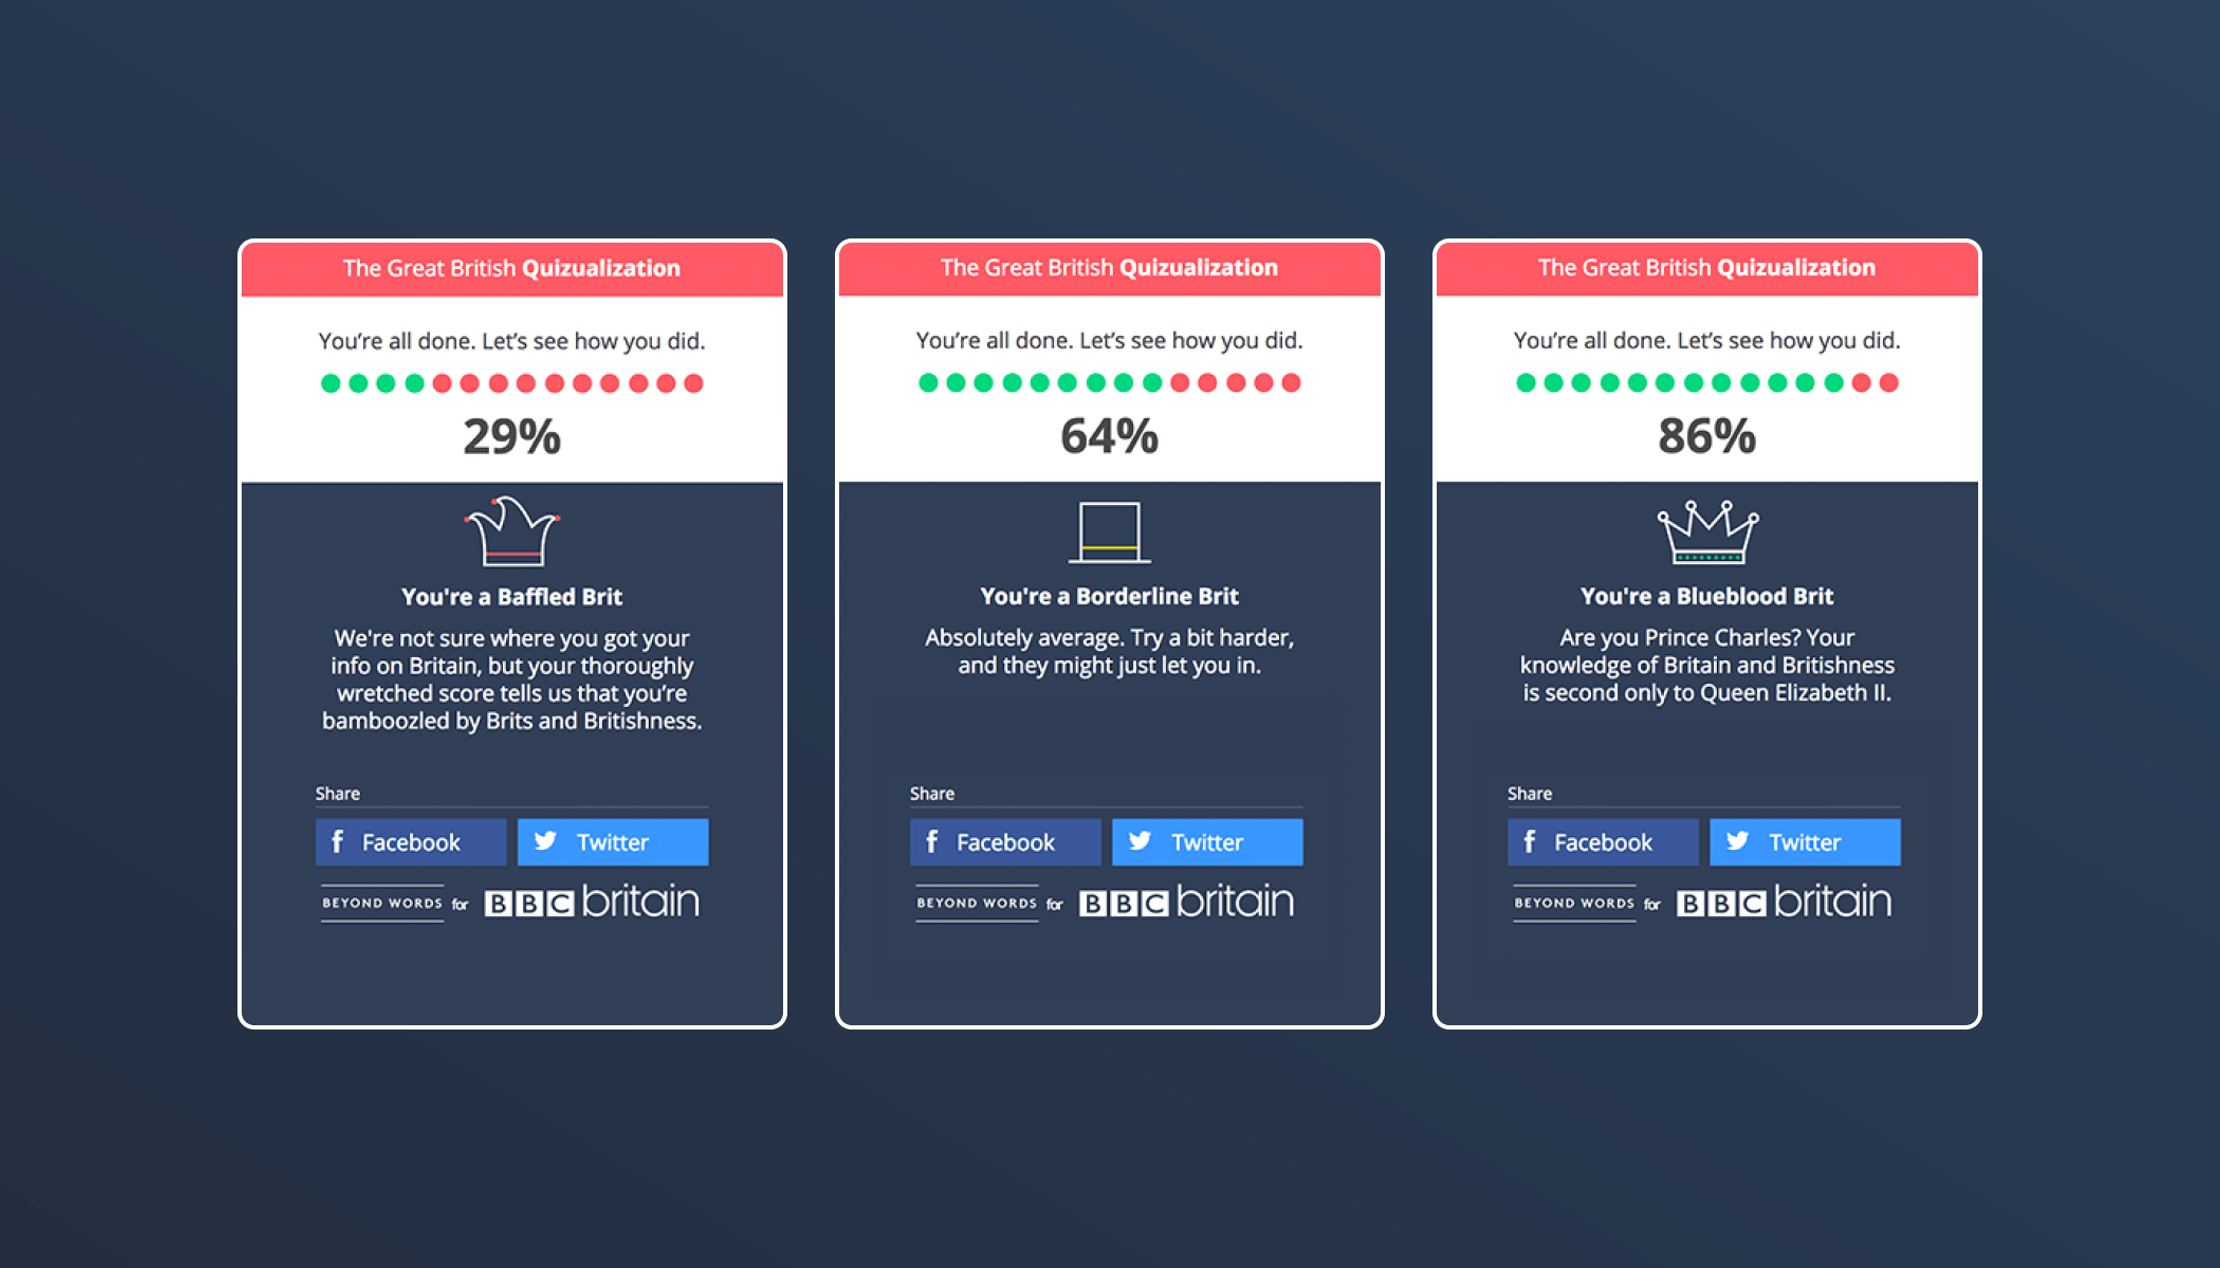
After all, who wouldn’t want to know if they’re a Baffled, Borderline or Blueblood Brit? The quiz totted up the user’s score, ready for sharing with friends on social media. Give it a go.

Get in touch:hello@beyondwordsstudio.com

