State of Design & Make report

Autodesk asked us to craft a new approach to communicating data that could make a lasting impression.
Client

Autodesk

Autodesk's new global annual research study couldn't just be yet another number-heavy report. They asked us to craft a new approach to communicating data that could make a lasting impression.

Their research reveals how technology is transforming businesses at a startling speed – and how leaders in the design-and-make industries must adapt fast to keep up.

So we energised its biggest insights as a series of quickfire animated stories that move with pace, colour and clarity. Each one smartly summarised a key topic from the report – from evolving workforce to sustainability – and drove audiences to discover the full research.

A collage of stills used in the State of Design and Make video.
A still from the Autodesk videos, it explains that 2 in 3 companies are struggling to find workers with the right skills.
100 dots in a diamond shape. From the bottom, 72 of the dots are filled in blue and a label says 'But 72% of more digitally mature companies say they are equipped to handle rapid change,
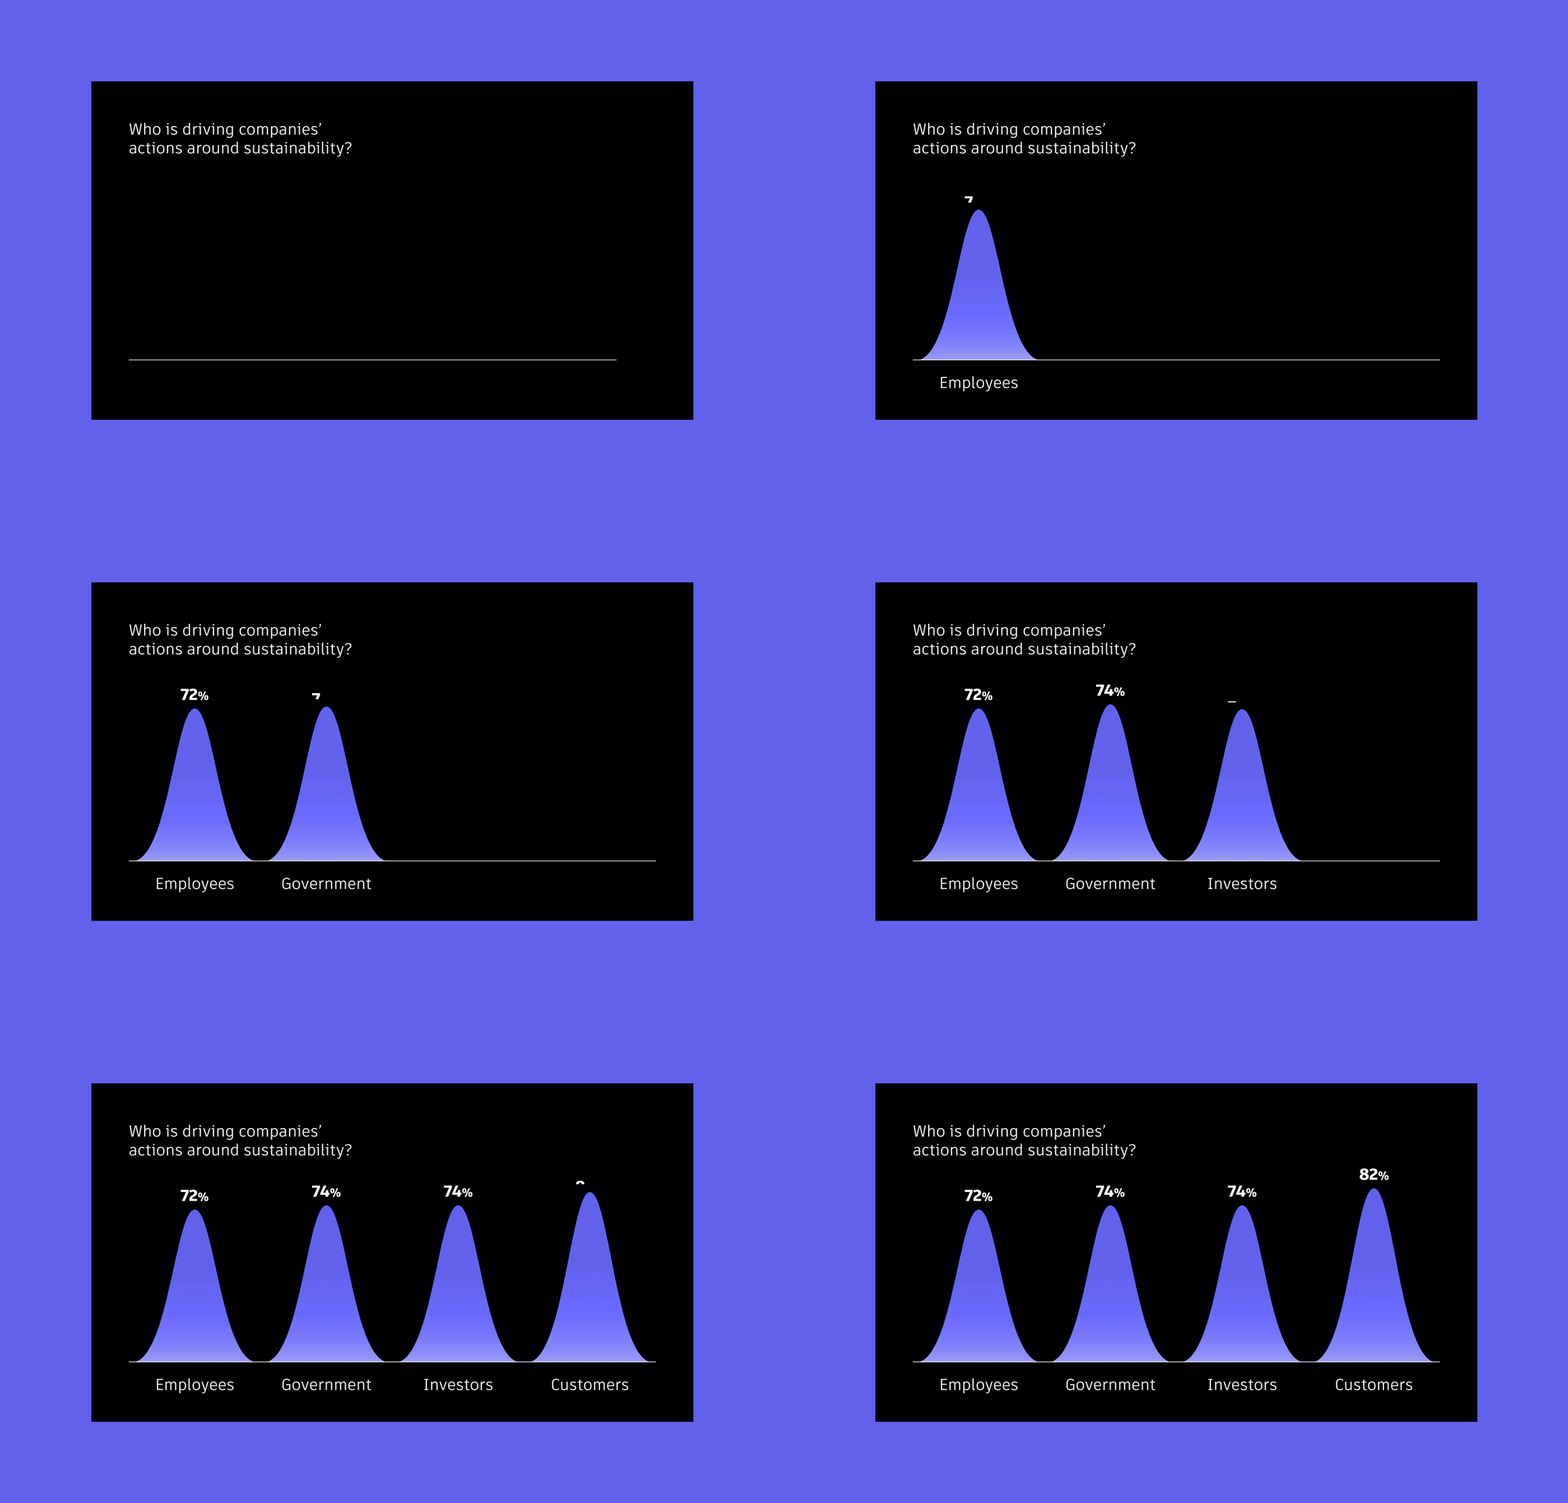
An animated gif of a bar chart showing who is driving companies' actions around sustainability. Employees are the lowest at 72%, customers were the highest at 82%.
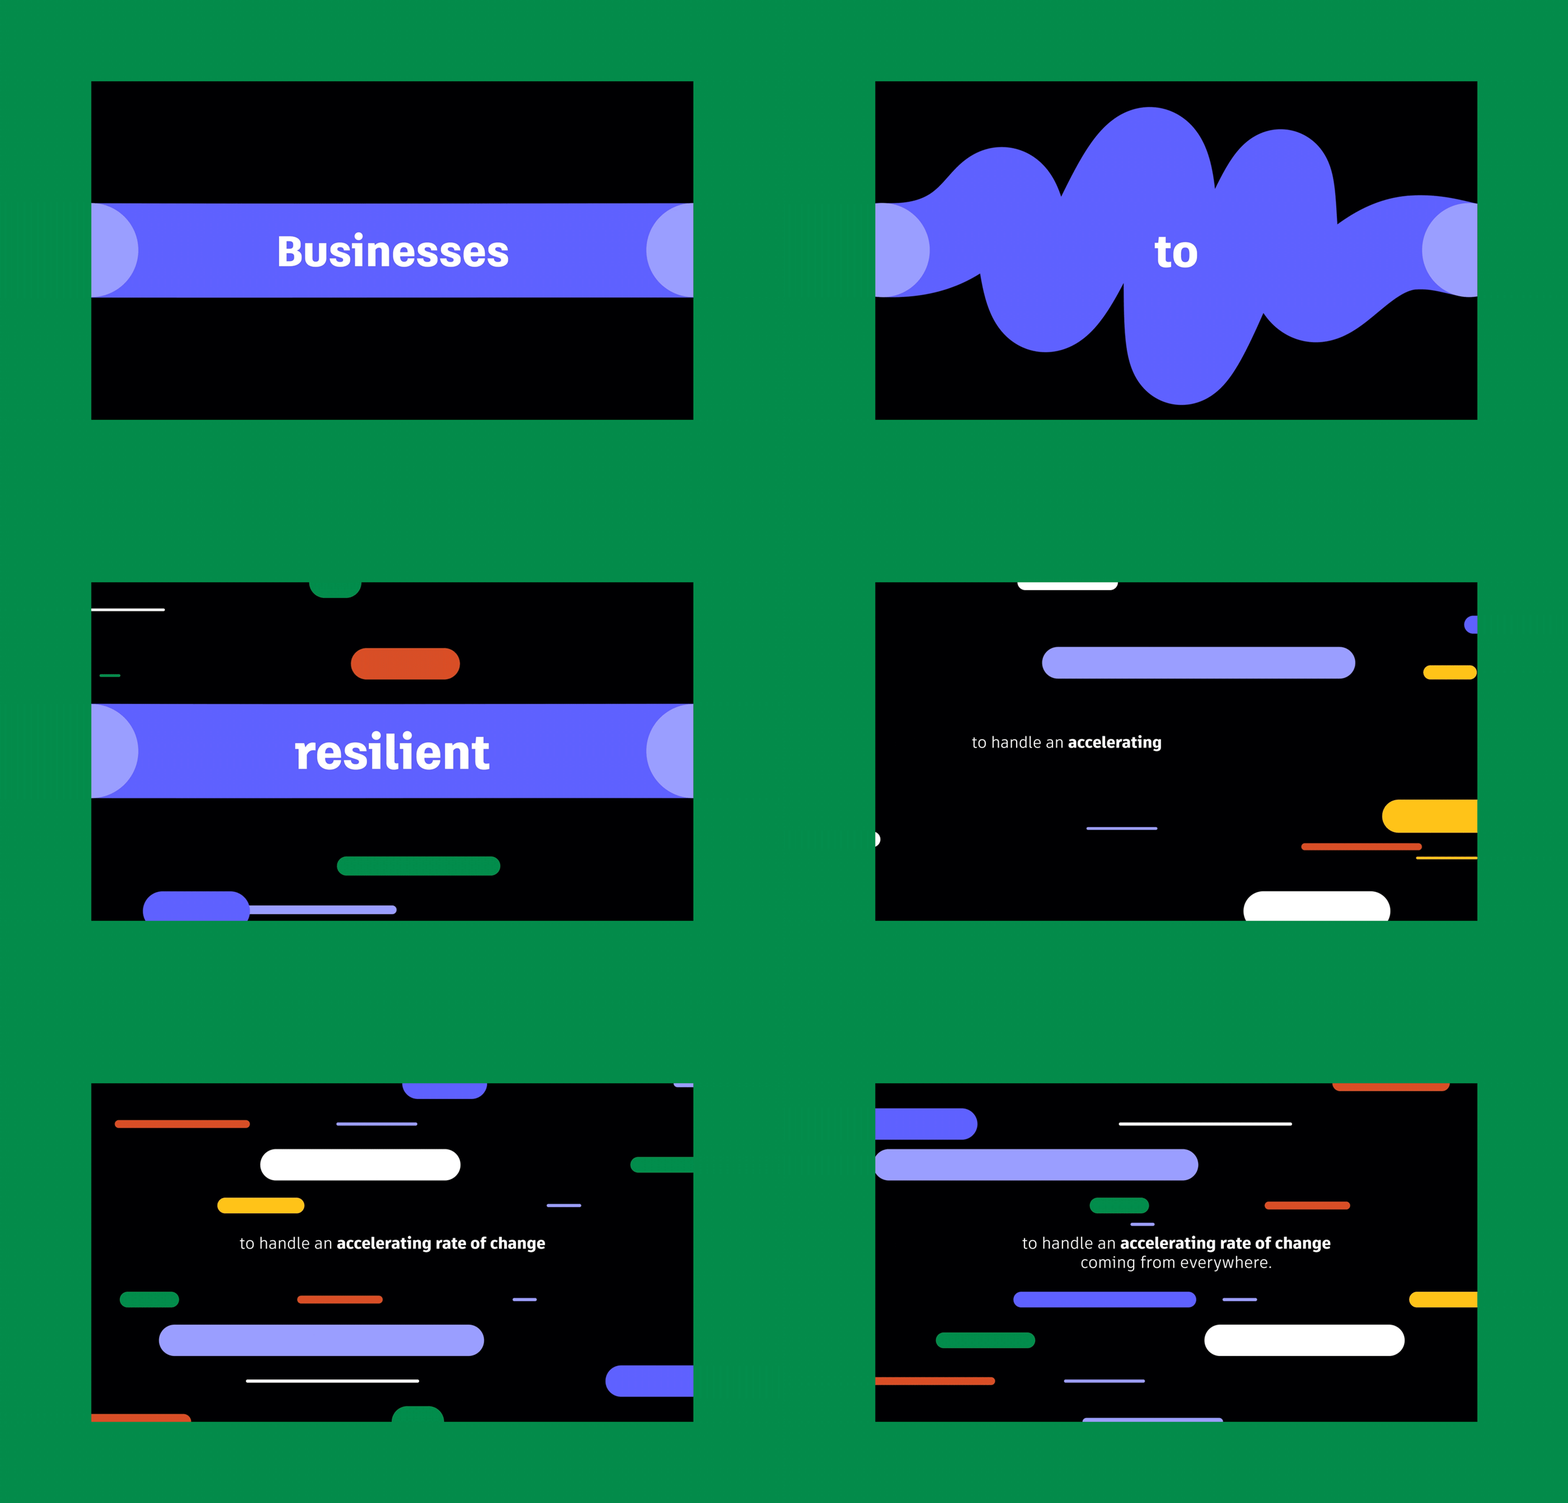
An animated gif from the video that shows text alongside a stream of colourful shapes. It reads businesses need to be resilient to handle an accelerating rate of change coming from everywhere.

The report

For the report itself, we created a fresh visual system of smart, bold charts that made each data story impossible to ignore and easy to understand. Across every platform, these assets are helping to drive the project’s central mission – inspire leaders to urgently invest in digital transformation – and cementing Autodesk’s leading status in design-and-make.

A selection of different data visualizations used in the State of Design & Make report and exploring trends like sustainability and digital maturity.
A page from the State of Design & Make report showing how respondents in different  industries answered about their sectors stability now and in the future.
A page from the Design & Make report. It shows text on the left page and on the right, two vsiaulizations looking at who is driving sustainability in different sectors, and who is driving sustainability at different company scales.
Two waffle charts with 100 circles representing respondents answers. One shows the percentage of respondents who felt the future global landscape felt more uncertain than it did 3 years ago (79%). The other shows the proportion of respondents who felt their company was well prepared to handle future geopolitical challenges, (59% said yes.)
A visualization of how survey respondents ranked different benefits of digital transformation. The highest ranked answer was reduced costs.

Get in touch:hello@beyondwordsstudio.com

beyond words logo
Follow us
TwitterInstagramLinkedInYouTube
Find us
Beyond Words Studio UK 91 Brick Lane London, E1 6QL
Beyond Words Studio US Florida, USA
Beyond Words Studio EU Dublin, Ireland
Copyright Beyond Words Studio Ltd. 2024