Vaccine sharing

The Wellcome Trust wanted a series of highly shareable visualizations that could grab the attention of policy-makers in G7 countries.
Client

Wellcome Trust

A horizontal bar chart showing the percentage of their populations countries were able to cover with their vaccine supplies as of March 2021. It shows 12 countries could cover more than their populations, while the majority can't protect everyone in the country.

Back in 2021, while most of the world struggled to access COVID-19 vaccines, a small handful of developed regions like the UK, US and EU purchased up to five times as many doses as they needed to vaccinate their entire adult populations.

The Wellcome Trust wanted a series of highly shareable visualizations that could grab the attention of policy-makers in G7 countries. Their message? That sharing vaccines was more than a moral imperative, it was a quicker, cheaper and safer way out of the pandemic.

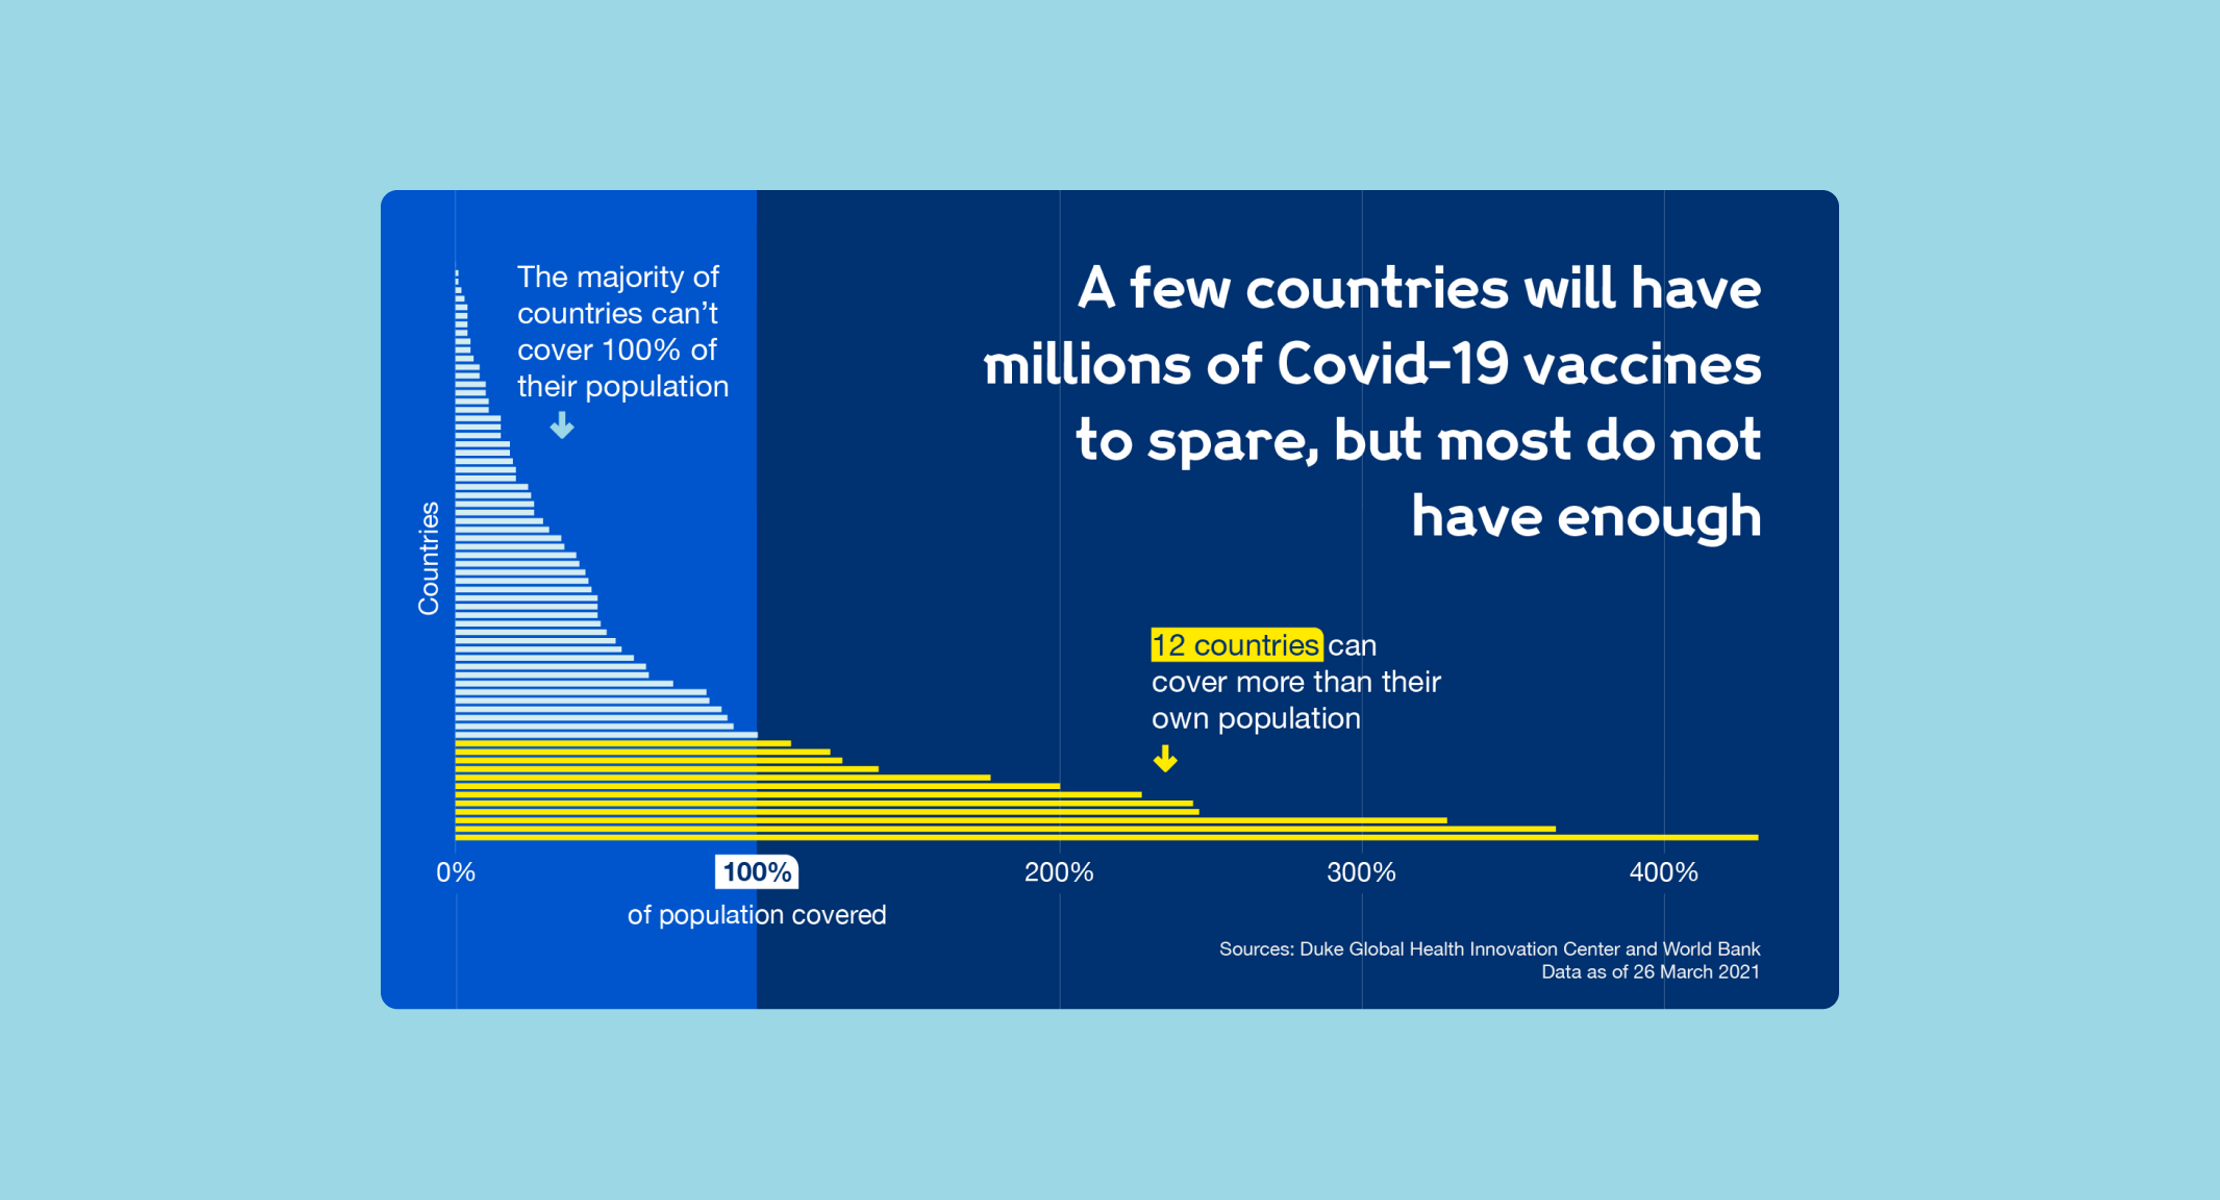
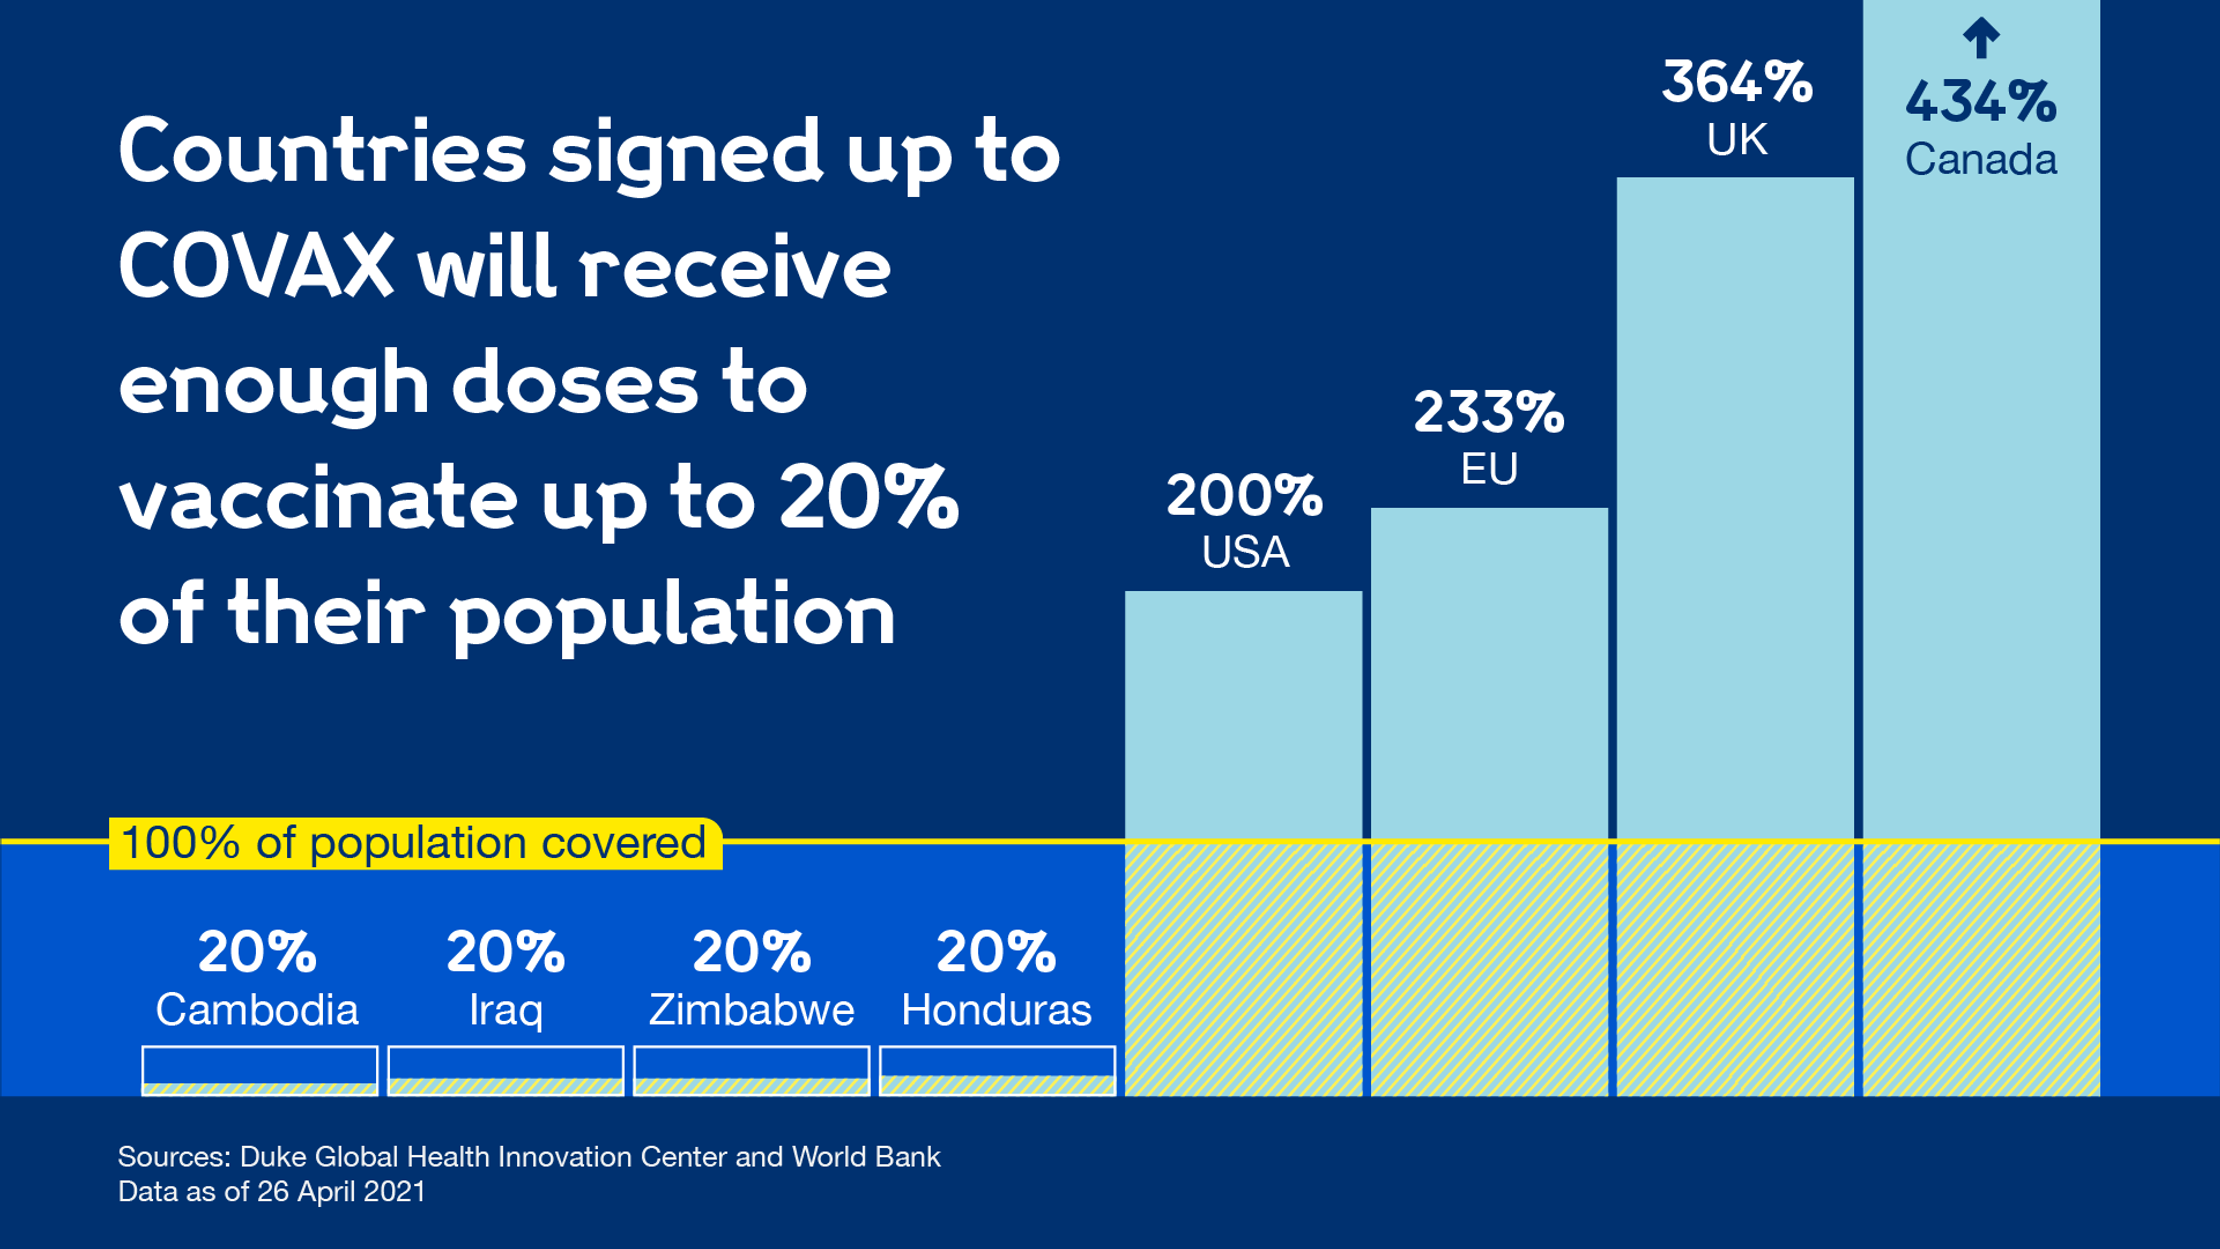
Sometimes the global imbalance was literally off the charts. We didn’t shy away from letting some countries’ excess outgrow the boundaries of our visualizations.

Animating the charts let us hold the reveal between the ‘haves’ and the ‘have nots’ until the end of a GIF, creating a memorable jump that emphasised the gulf between the two.

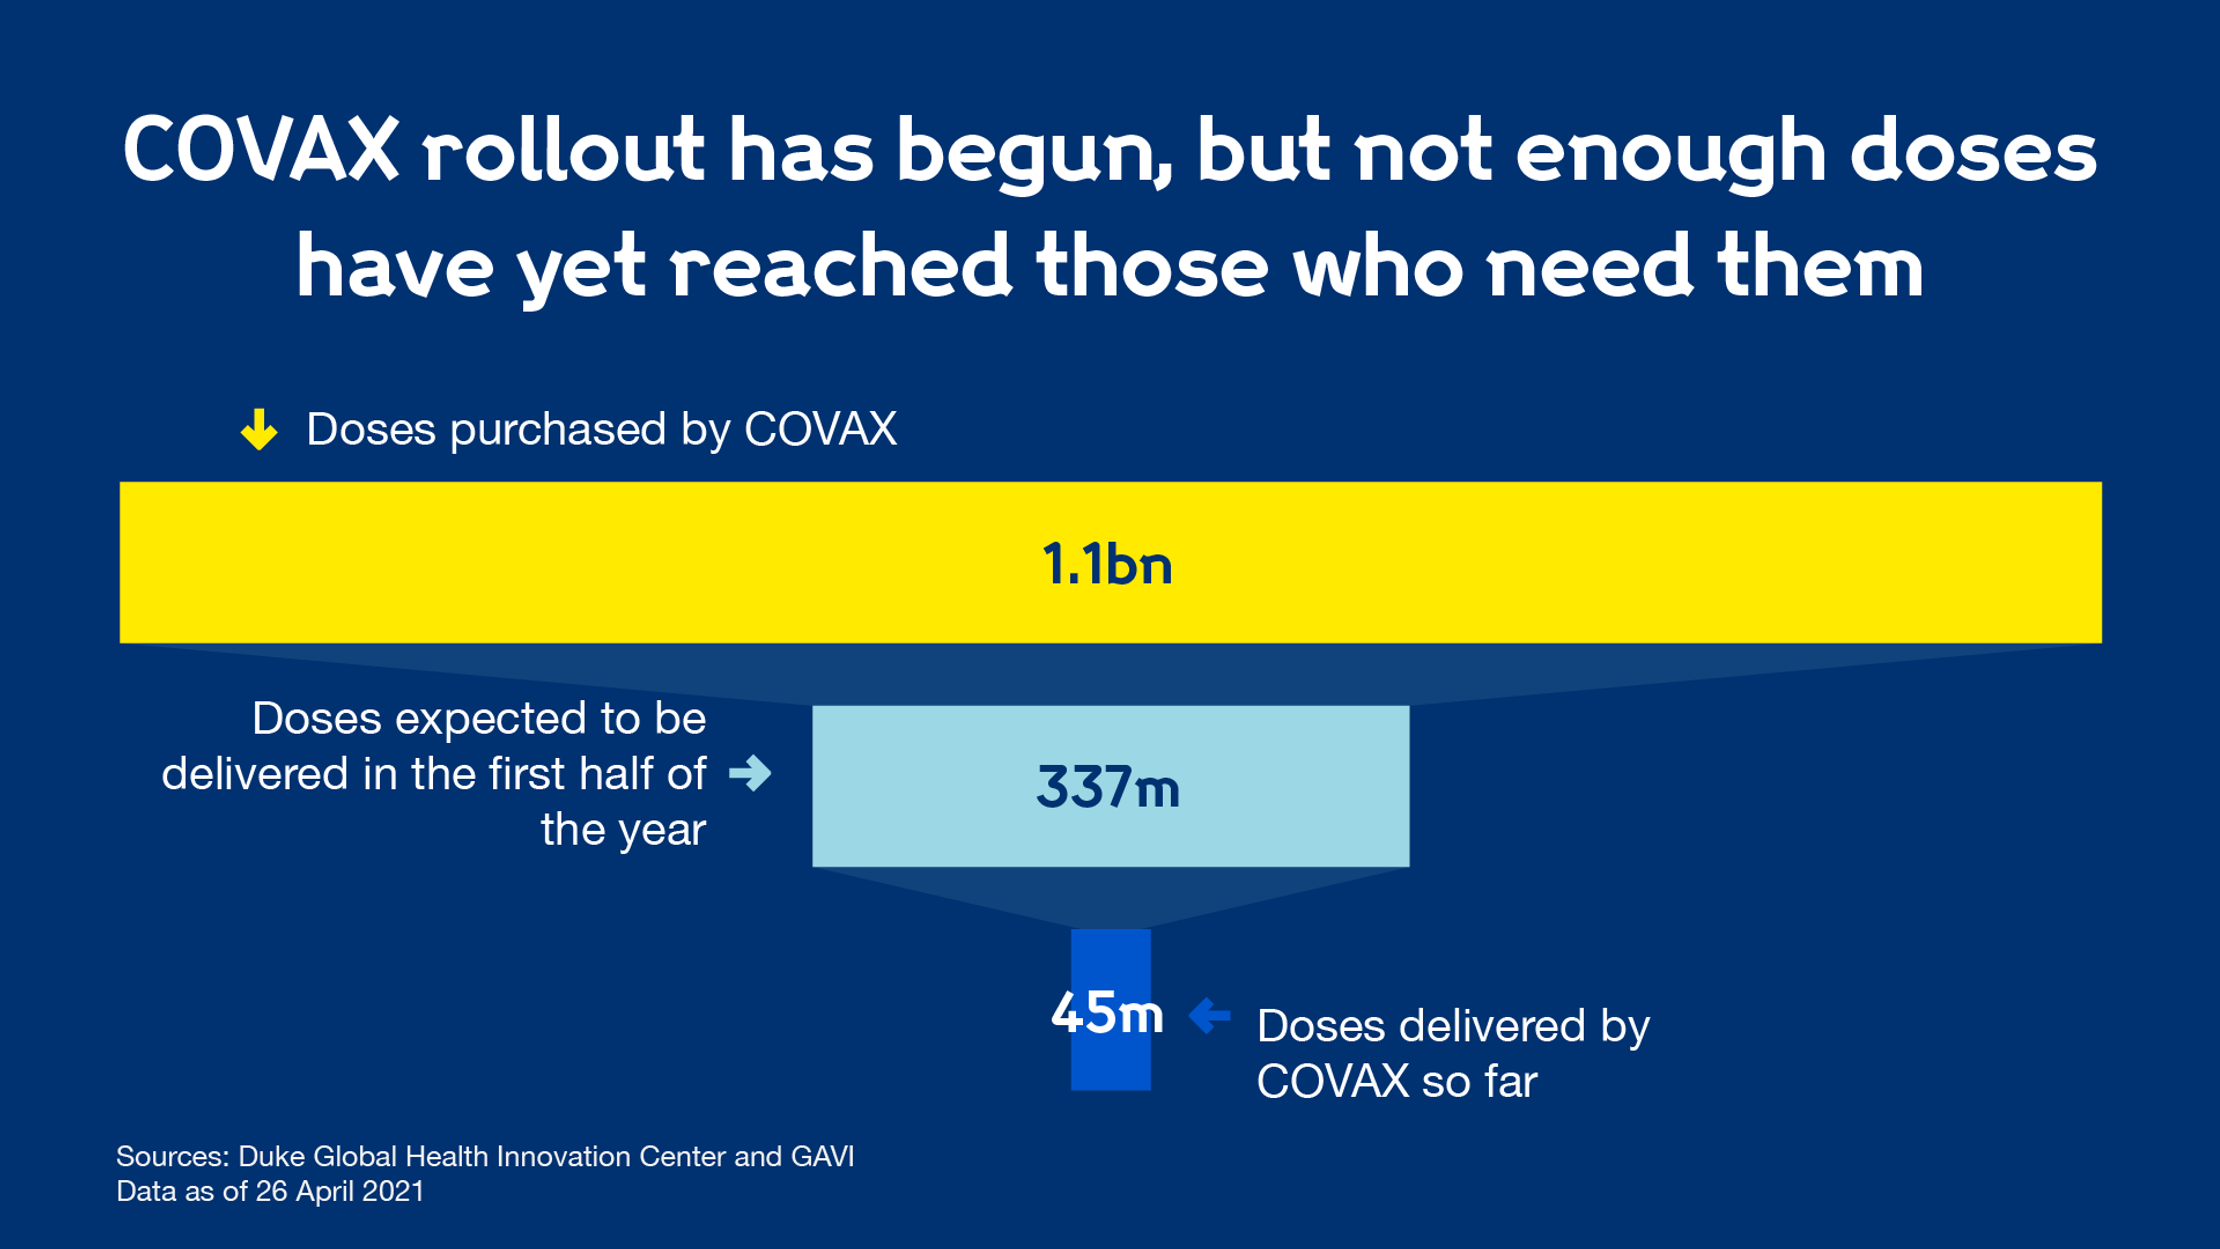
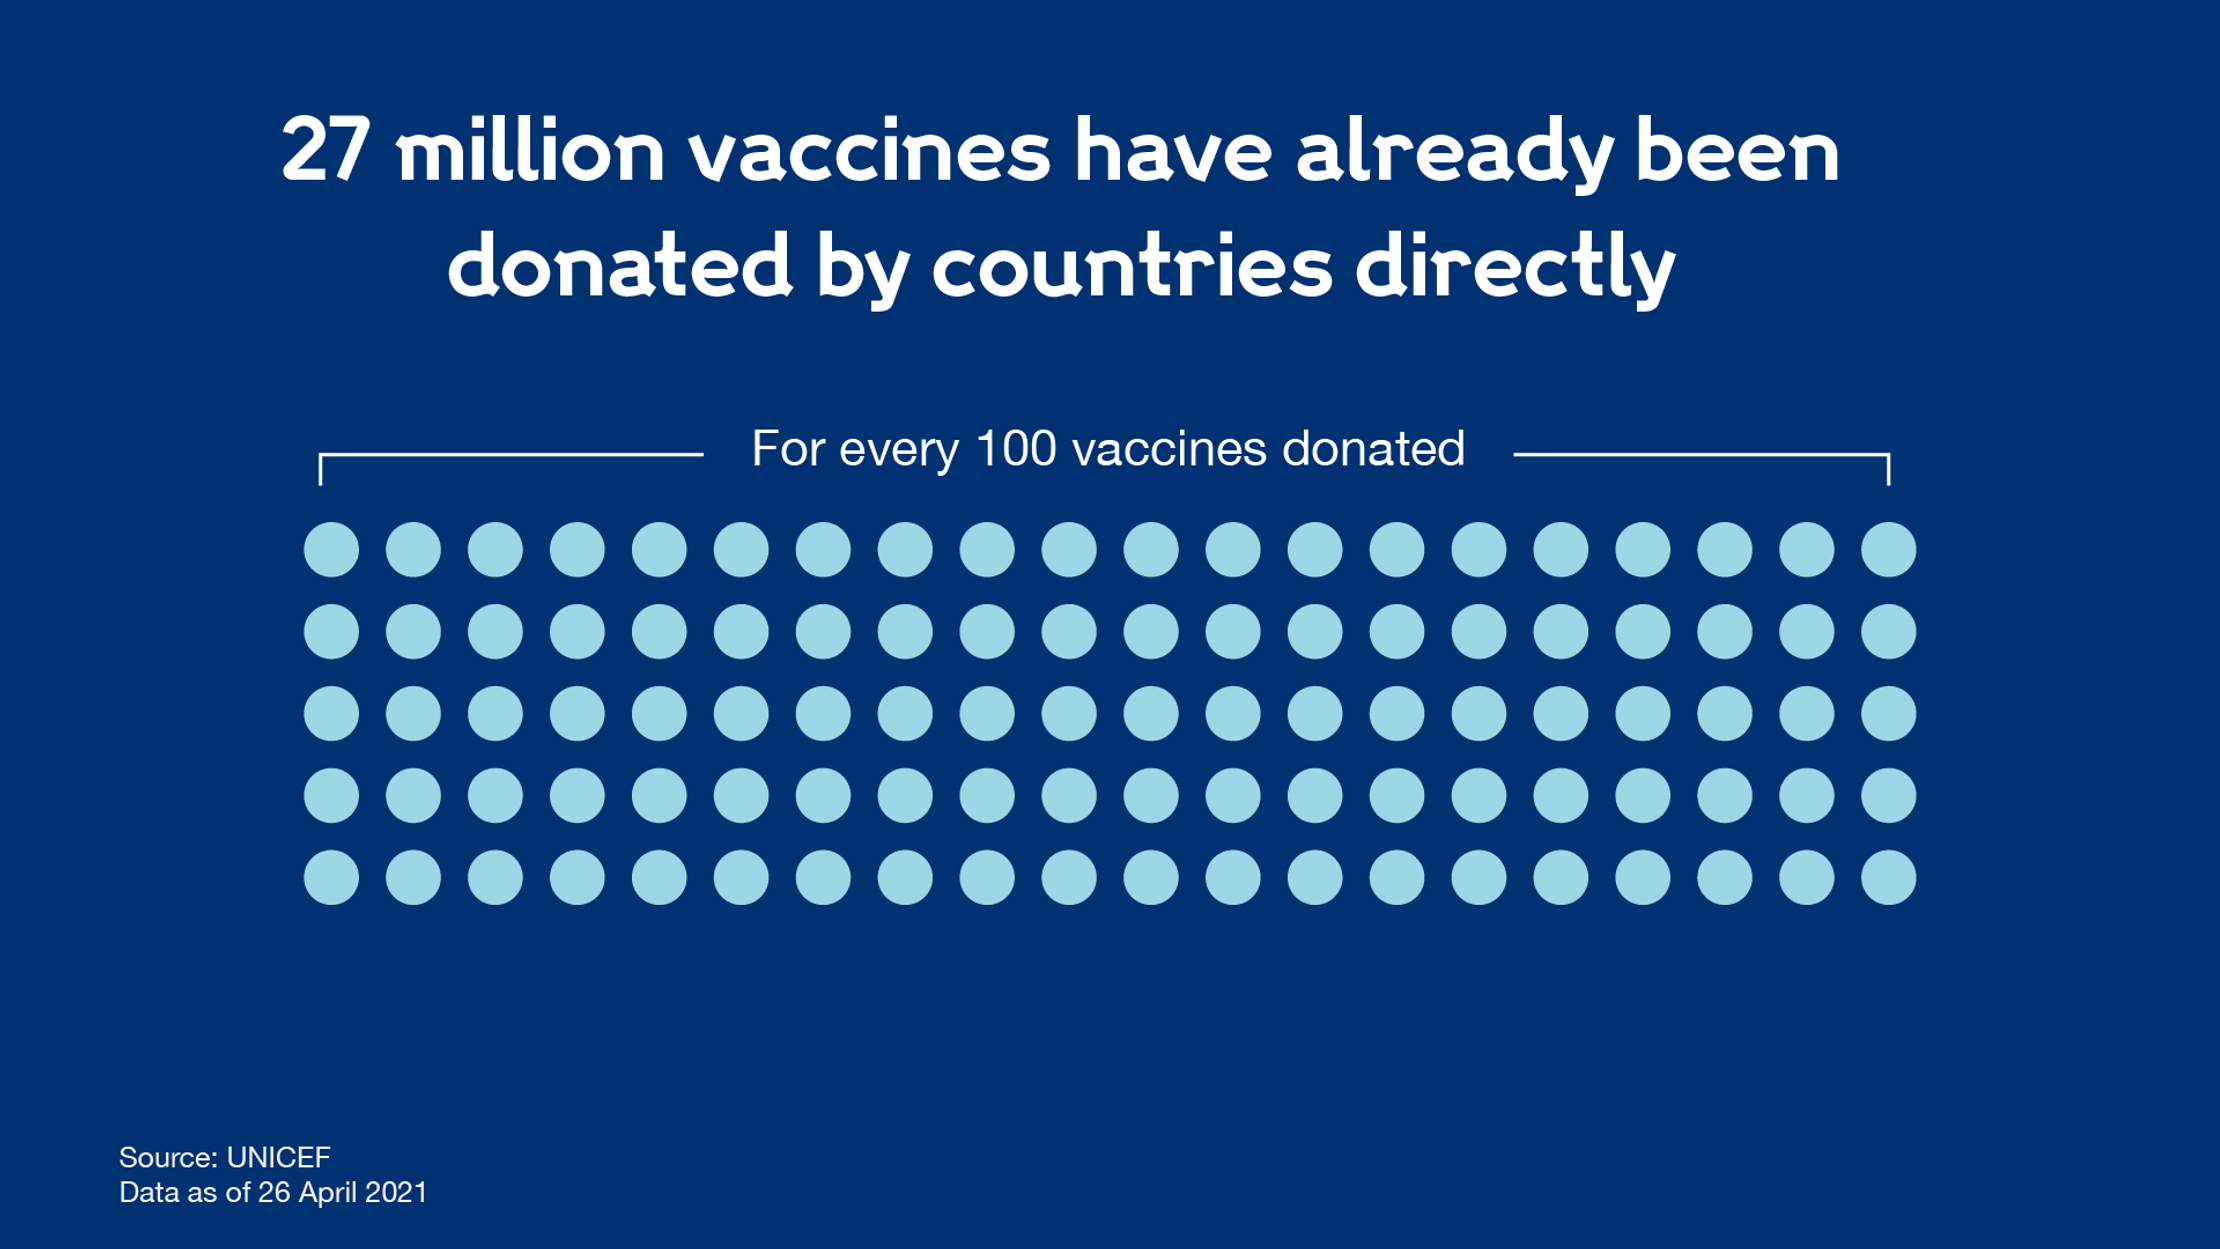
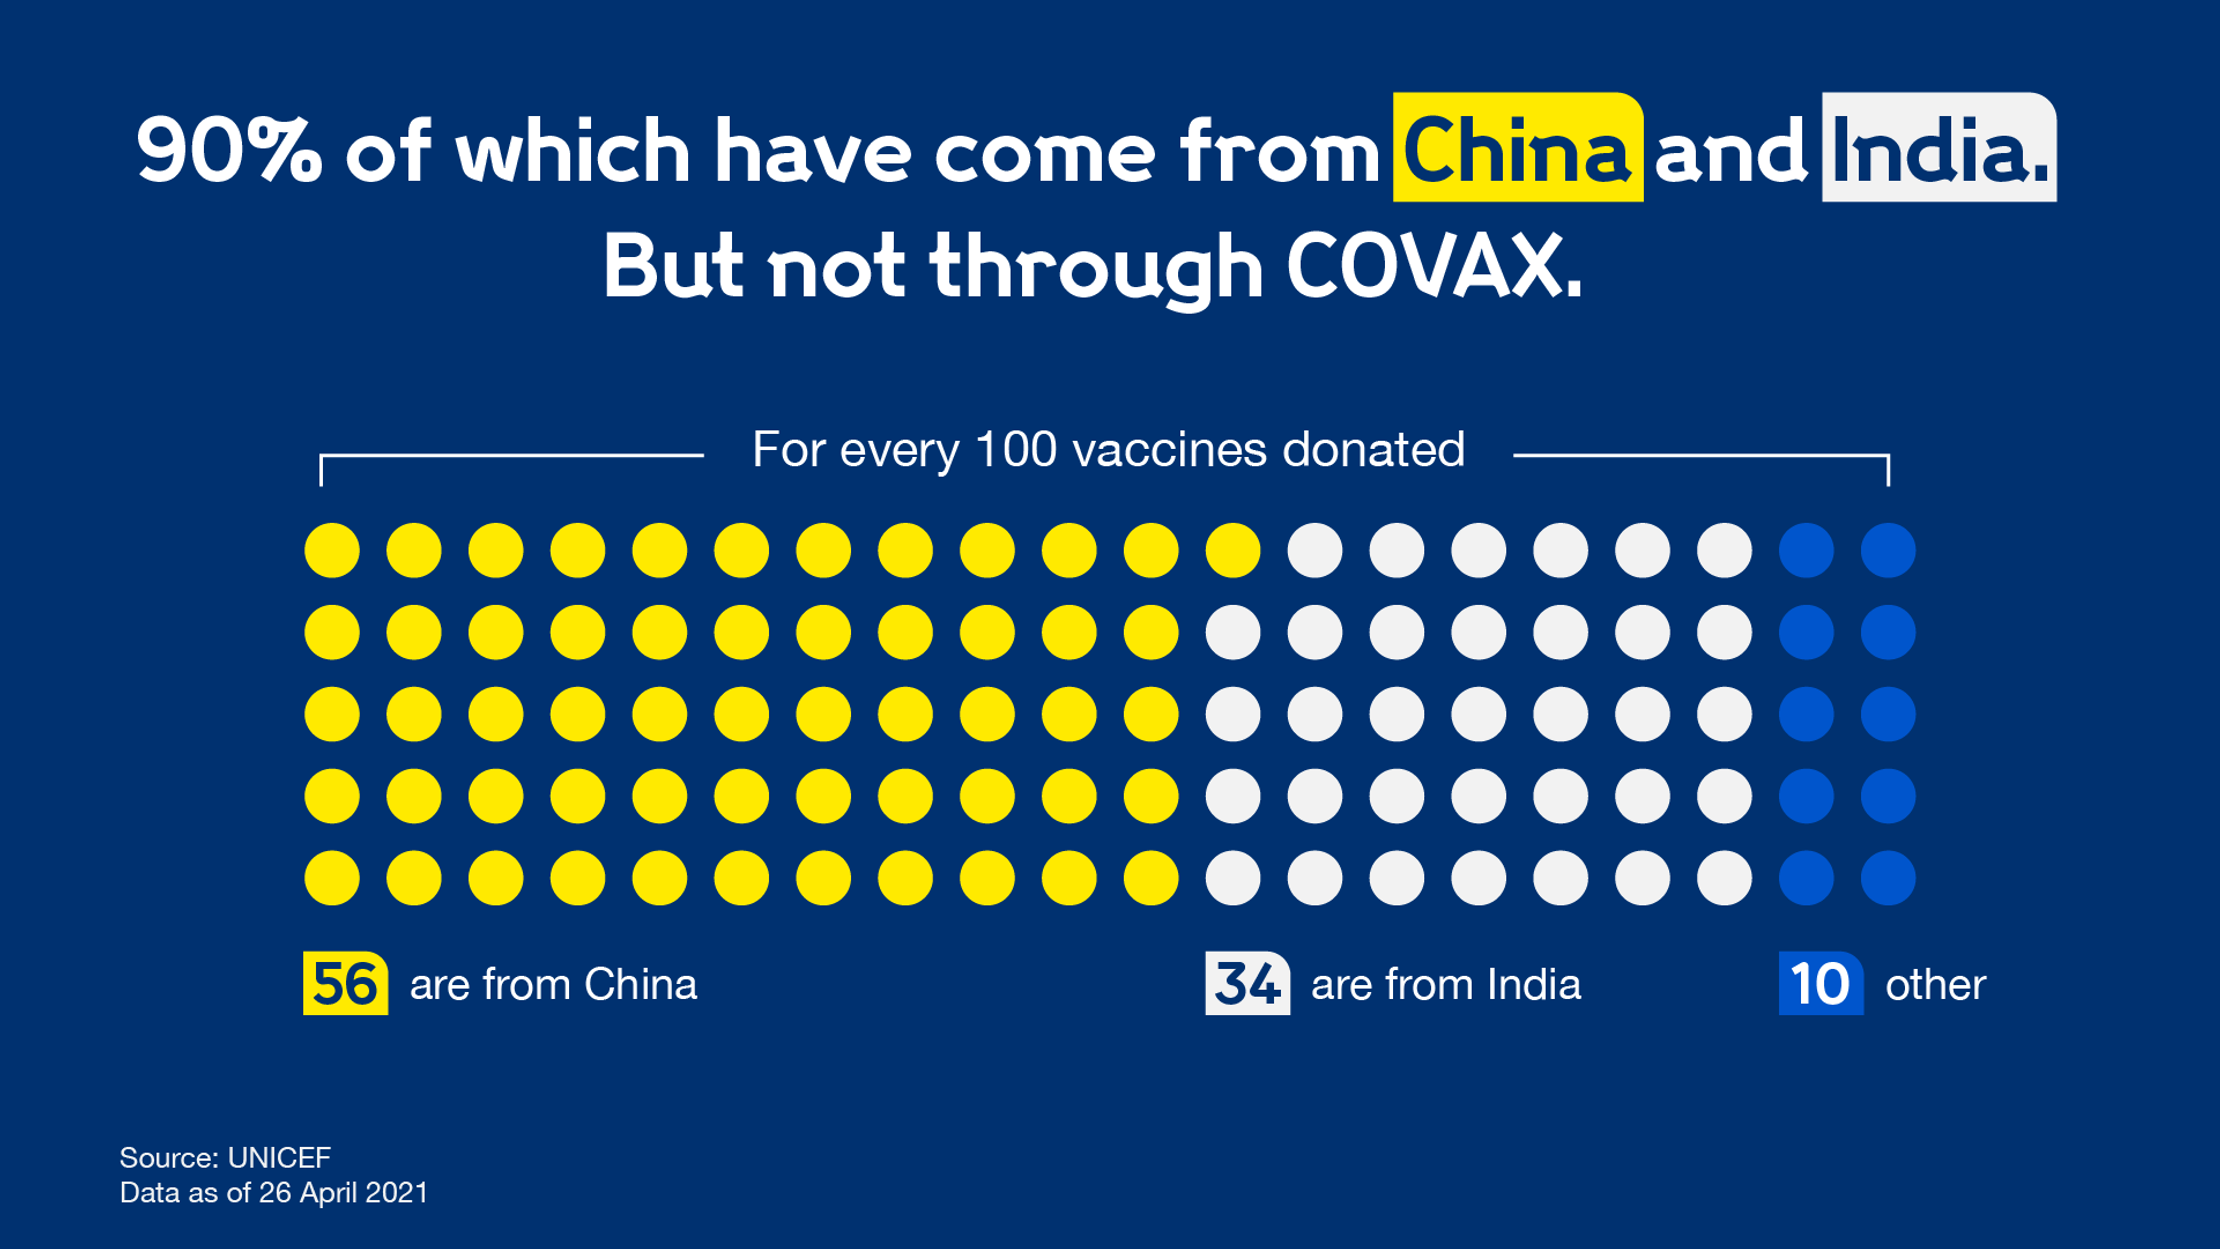
The Wellcome Trust colour palette played to our storytelling. Bright yellows on cool blues let us steer the eye to the crux of each visualization’s message.

The final materials were a social success, spreading a message that leading policy-makers badly needed to see.

A bar chart showing how much of their populations different countries and regions will be able to protect with their COVID vaccine supply as of April, 2021. It shows countries signed up to COVAX like Cambodia and Iraq will receive enough vaccines to cover 20% of their populations, regions while r like the USA or EU will be able to cover more than double their populations with their supply.
Three horizontal bars, starting with the widest at the top, narrowing to the narrowest at the bottom. Each shows vaccine doeses in different stages of the COVAX vaccine rollout. The first bar, 1.1 billion is the doses purchased by COVAX. The second bar, 337 million is the doses expected to be delivered in the first half of 2021. And the last bar, 45 million is doses delivered by COVAX so far.
A grid of 100 blue dots labelled 'for every 100 vaccines donated'.
A grid of 100 dots representing donated vaccines not through the COVAX scheme. 56 dots are yellow representing vaccines from China, 34 are from India, and 10 are 'other' donors.
An animated gif that begins with a single bar representing 19 million COVID vaccineations given every day. This then widens to include 39 bars, representing the number of days needed to vaccinate all of the world's most vulnerable people.
An animated gif illustrating the two paths countries can take with vaccine distribution and the financial cost. Tthe nationalistic approach of hoarding vaccines leads to $9.2 trillion in losses to GDP in 2021. Meanwhile the path to funding vaccines, tests and treatments for everyone who needs them is a compartively small $19.1 billion.

Get in touch:hello@beyondwordsstudio.com

beyond words logo
Follow us
TwitterInstagramLinkedInYouTube
Find us
Beyond Words Studio UK 91 Brick Lane London, E1 6QL
Beyond Words Studio US Florida, USA
Beyond Words Studio EU Dublin, Ireland
Copyright Beyond Words Studio Ltd. 2023