We turn complex topics into compelling visual stories

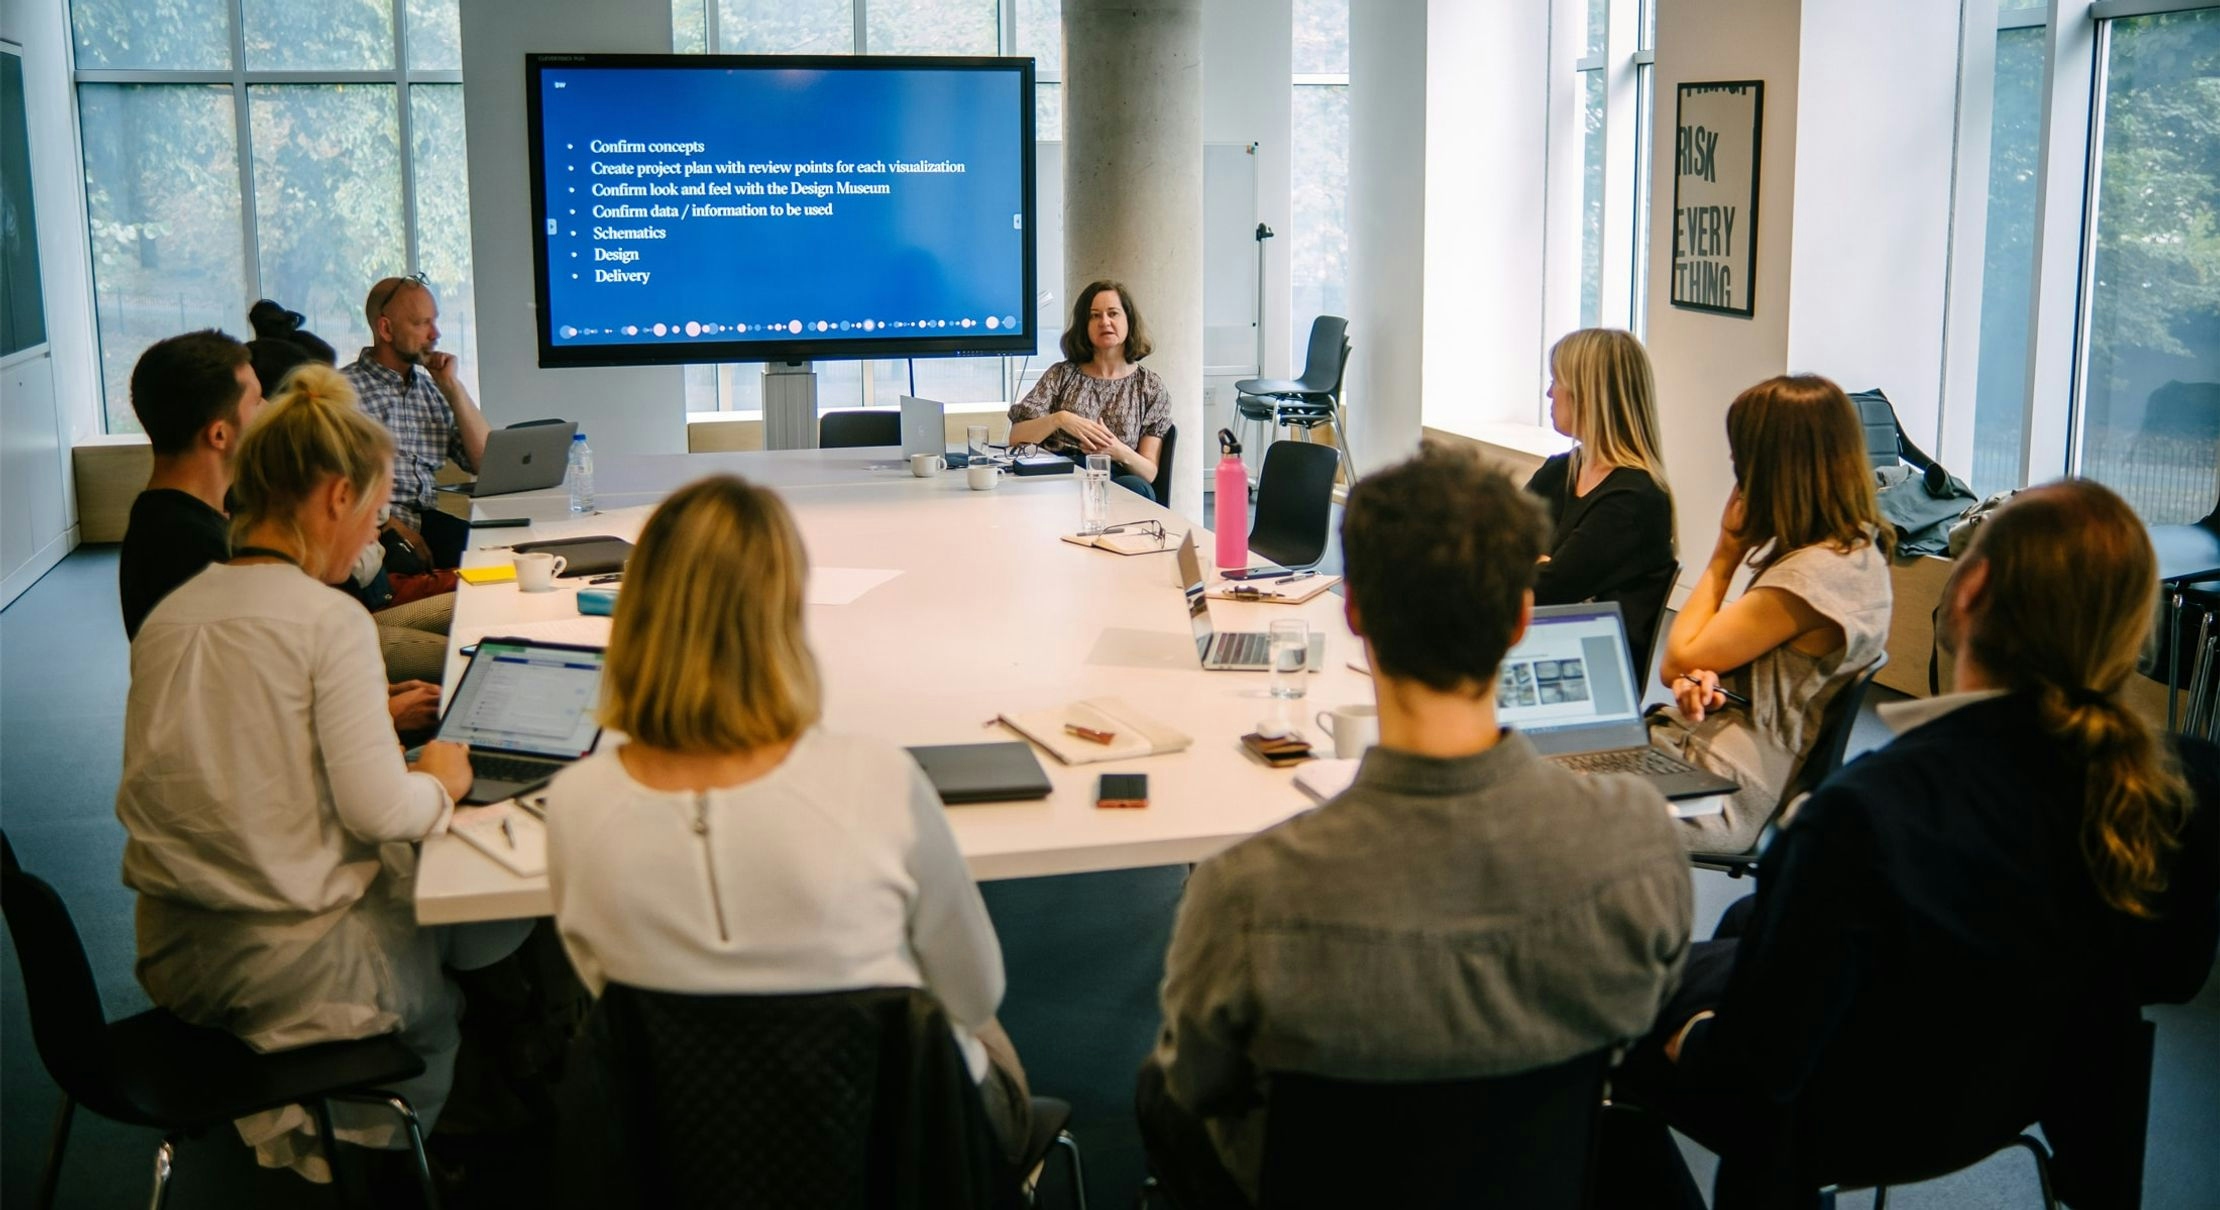
Workshops, events and presentations

Previous

2023
Microsoft Online Presentation to Microsoft's design community about the 'Power of data visualization'.
London College of Communication London Annual lecture to MA Data Visualisation students.
Amsterdam University of Applied Sciences talk London Presentation to students about how we use data visualization to communicate clear, engaging messages to create impact for our clients.
British Academy London Part of an Expert Roundtable on Communicating Scientific Evidence Visually with Sense about Science and The London School of Hygiene and Tropical Medicine.
2022
London College of Communication London Lecture to Data Visualisation MA students.
Culture Amp Online Fireside chat to the design and data visualization team at Melbourne-based Culture Amp.
Data Visualization Society Fireside chat on hiring Creative Partner Duncan Swain in conversation about what we look for when interviewing a data visualization designer.
2021
London College of Communication London A series of talks looking at different careers opportunities in data visualization.
S-H-O-W 2021 Online Using data to change the world.
London College of Communication’s Design School Lecture Series London Series of lectures where we spoke alongside design luminaries such as Alice Rawsthorne, Tamika Abaka-Wood and Richard Van der Laken.
2020
London College of Communication London Our annual talk on what we do and how we do it to the 2021 crop of students on LCC's MA in Data Visualisation.
Coding workshop London A free workshop for the Coding Black Females network, about how to use coding for data analysis and visualization.
Vodafone _VOIS Conference 2020 London Putting heart and soul into data visualization, a presentation and Q+A with 20,000 Vodafone staff around the world.
Designing with Data London A talk about our process alongside the Met Office to set a brief about climate change for the YCN awards.
2019
London College of Communication London Presenting to this year's new MA Data Visualisation students, helping them understand how we explore and visualize data.
Cytora Sessions London Discussing our story-led approach at this event focused on data science, engineering, strategy and design.
encode conference London Sharing our thoughts and experiences on the power of truthful data to make a positive change in the world.
EDCH conference Munich Speaking about data visualization at this three-day festival for journalists and visual storytellers of all kinds.
WHO workshop Amsterdam Helping the World Health Organization to understand more about how to effectively visualize data.
London College of Communication London A hands-on data visualization workshop with the students of the MA in Data Visualisation.
2018
Data Natives Berlin Attending the conference on tech that’s shaping the data-driven generation.
Paris Peace Forum Paris Providing visualization and digital expertise to the hackathon at the inaugural Paris Peace Forum.
London College of Communication London Talk on data journalism and our process to the students of the inaugural MA in Data Visualisation.
World Health Organisation workshop Slovenia Helping international WHO teams to visualize health data.
Visualizing Knowledge 2018 Helsinki Discussing how information design can reveal unknowns and inspire actions.
Financial Times presentation London Presenting our work to the FT's international graphics team.
YCN: Data, design and digital UX London Sharing insights on using data to design meaningful user experiences.
Data4Change Beirut Design mentoring for human rights organisations.
Hyper Island Stockholm Workshopping on data visualization at the "digital Harvard", Sweden's renowned creative business school.
2017
Malofiej Spain On the judging panel and speaking at the world's most venerable data visualization conference.
Hyper Island Stockholm Workshopping on data visualization at the "digital Harvard", Sweden's renowned creative business school.
2016
Data4Change Beirut Mentoring researchers, designers and developers in creating data visualizations for human rights organisations.
Collaborative Gain New York Sharing our experience in data storytelling with some of the US's industry-leading companies.
Visualized Conference New York 'Lost for Words' was our workshop on the importance of headlines, standfirsts, captions, labels and any other text in data visualizations.
New York Public Library New York 'What can data do for the New York Public Library?' was our presentation to the Chief Digital Officer and his team.
BBC Worldwide London 'What is data visualization?' was our presentation to senior marketing executives at BBC Worldwide.
D&AD Awards London We pioneered, and were part of the jury for, D&AD's very first data visualization category.
2015
European Commission workshops Brussels A series of how-to data visualization workshops across the European Commission.
Data Rave London Hosting this inaugural celebration of all things data at our Shoreditch studio.
London College of Communication London 'The place of data visualization in design' was our presentation to 250 of LCC's student faculty.
Department of Health London 'The power of data visualization and public policy' was our presentation to a selection of influencers with the Department of Health.
2014
D&AD New Blood London Representing all things data on a panel at 2014's New Blood.
Google Squared workshops London We devised and ran regular data visualization workshops as part of Google's digital marketing leadership course aka Google Squared.

Appearances in the press & publications

Some of our press coverage
YCN Magazine You Can Now - The Learning Issue
D&AD Data Visualization at the D&AD Awards
Creative Review The story behind the studio
NPR How global health has changed since you were born
Design Week Visualizations for a design survey
Digital Arts Apocalypse when?
Fast Company See your life through the lens of history
Creative Bloq Find out how we're all going to die
BBC America Visualizing Doctor Who
London Design Festival 2016 Design-led data visualization
Selected books we feature in
Data-driven Storytelling by Nathalie Henry Riche, Christophe Hurter, Nicholas Diakopoulos, Sheelagh Carpendale Introduction to data-driven storytelling
The Book of Circles by Manuel Lima 'Stock Check' visualization
Data Visualization for Success by Steven Braun Interviews with 40 experienced designers